speccurvieR, as well as demonstrating its use with real world data. If you’d like to try out the package yourself, it’s available on CRAN. If you have suggestions for features or encounter problems, don’t hesitate to create an issue on GitHub.1 Part 0: Motivation
Before getting to the actual problem that motivated me to develop speccurvieR, it’s worth discussing the underlying motivations for dipping one’s toes into package development.
1.1 Growth as a programmer
Once you grasp the fundamentals of a programming language, and especially once you have been using it daily for years, it’s easy enough to hack something together for a use-case you come across that hasn’t been answered 20 times on Stack Overflow. It takes another level of understanding, both of the language and best programming practices, to write code someone else will interact with some day.
For those working in software development professionally this challenge comes early on. If you learn programming through higher education, your computer science or related degree will at some point require a software development course where you work collaboratively on a project or at least where you are expected to write code following a certain style guide. For those programming in a more applied way, i.e. social scientists using R or Python, this training either never happens or comes relatively late in your career, maybe in graduate school when you work as a research assistant. The result is a norm in many fields of hacked together code that gets the job done but doesn’t even remotely attempt to follow best practices. Unfortunately, many undergraduate and graduate students’ first exposure to programming is code written in this way.
This not only makes learning to code much more difficult–parsing another’s code with sporadic commenting and inconsistent naming conventions is tough–but it signals to the next generation of researchers that this kind of code is acceptable. For students taking a statistical programming course simply to knock out a requirement, a political theorist for example, this isn’t going to cause many problems down the line. Even for someone who will use statistical computing for rudimentary tasks, say running a regression or making a histogram here and there, this isn’t necessarily a big deal. However, as the social sciences continue on their quantitative trajectory, many will need to use more advanced methods if they’re going to build on existing research. Not only that, but the new norm of providing replication materials requires even those not employing advanced methods to write clean, reproducible code. The reality is that many programs do not adequately prepare the next generation of researchers to do this.1
Given this, writing code that others will use is a way to force yourself to think more carefully about how you construct and document your work. Developing a package intended for CRAN means you have clear standards to adhere to and resources to help you do so (more on that later). Not just that but anticipating someone else interfacing with your code forces you to consider edge cases as well as make your code more efficient and user-friendly than you might when coding for yourself.
1.2 Contributing to open source
Beyond practical skill-building, there are more idealistic reasons to develop a package. Almost all empirical social science work in the past decade lies on the shoulders of software written and maintained for no pay and little recognition. For this to keep working, developers need to keep sacrificing their time for the common good. As someone who relies on open source software in my research and personal life, it feels right that I should give back by contributing software others can use. But open-source is a double-edged sword–it’s great not to need an exorbitant license for outdated software that may not even include the functionality you need (looking at you, STATA) but things can quickly crumble when maintainers stop maintaining and software breaks. This is something to consider before trying to develop a package with the intention that others will use it–you are committing to maintaining and hopefully improving your software for the foreseeable future.
1.3 Solving a problem
Fundamentally a package exists to solve a problem–ggplot solves the problem of ugly plots in base R, fixest solves the problem of base R’s lm() not (elegantly) including fixed effects or clustered standard errors, and so on. For me, the enjoyment of programming ultimately comes from encountering a problem and figuring out how to deal with it. Developing a package is trying to solve a problem you think others are facing and along the way you’re going to have to solve more nested problems, problems that are perhaps why no one has made the package you’re trying to. In this way, solving problems others haven’t is a rewarding experience that provides practical benefits not just to others but yourself. With that said, let’s get into the problem I try to solve with speccurvieR.
2 Part 1: The Problem
2.1 Why specification curve analysis?
When you first start running multivariate regressions it immediately becomes clear that model specification is everything. The omission of one control variable or even one observation can drastically change your coefficient estimates, statistical significance, model fit, etc. In an ideal world your model specification is determined a priori based on a theory of the phenomena being studied and even more ideally is pre-registered in a pre-analysis plan. This is perfectly feasible and in fact standard for research relying on experimental data but becomes challenging for observational studies where data availability and characteristics can impact modeling decisions (see e.g. Coffman and Niederle 2015). Suppose you plan to estimate a model where an independent variable is constructed from running a machine learning classifier on a series of texts to place them into three categories, \(A\), \(B\), and \(C\). You pre-register the following regression model:
\[Y = \alpha + \beta_AX_A + \beta_BX_B + {\boldsymbol{\beta}}_Z\boldsymbol{Z} + \varepsilon\] where \(\beta_A\) and \(\beta_B\) are the effects of a text being in category \(A\) and \(B\), relative to \(C\), on \(Y\) controlling for \(\boldsymbol{Z}\).
When you ultimately get your data and begin the classification process you find that, though your classifier converges when there are three categories, it performs better when you allow for an additional category, \(D\). Naturally, out of curiosity, you want to then estimate a model under a different specification:
\[Y = \alpha + \beta_AX_A + \beta_BX_B + \beta_DX_D + {\boldsymbol{\beta}}_Z\boldsymbol{Z} + \varepsilon\] with an added term, \(\beta_D\), for the effect of a text being in category \(D\). This is just one example of data exploration leading you to question your model specification and needing to try out alternative specifications.
This is easy enough to deal with when you’re only adding one or two variables but, thanks to combinatorics, quickly gets out of hand when you have multiple independent variables and numerous controls you want to try out. Suppose you have 1 independent variable, 5 controls, and want to estimate models with every combination of controls, that’s \(2^5=32\) models. Enter specification curve analysis (SCA): a framework for dealing with this exponential growth.
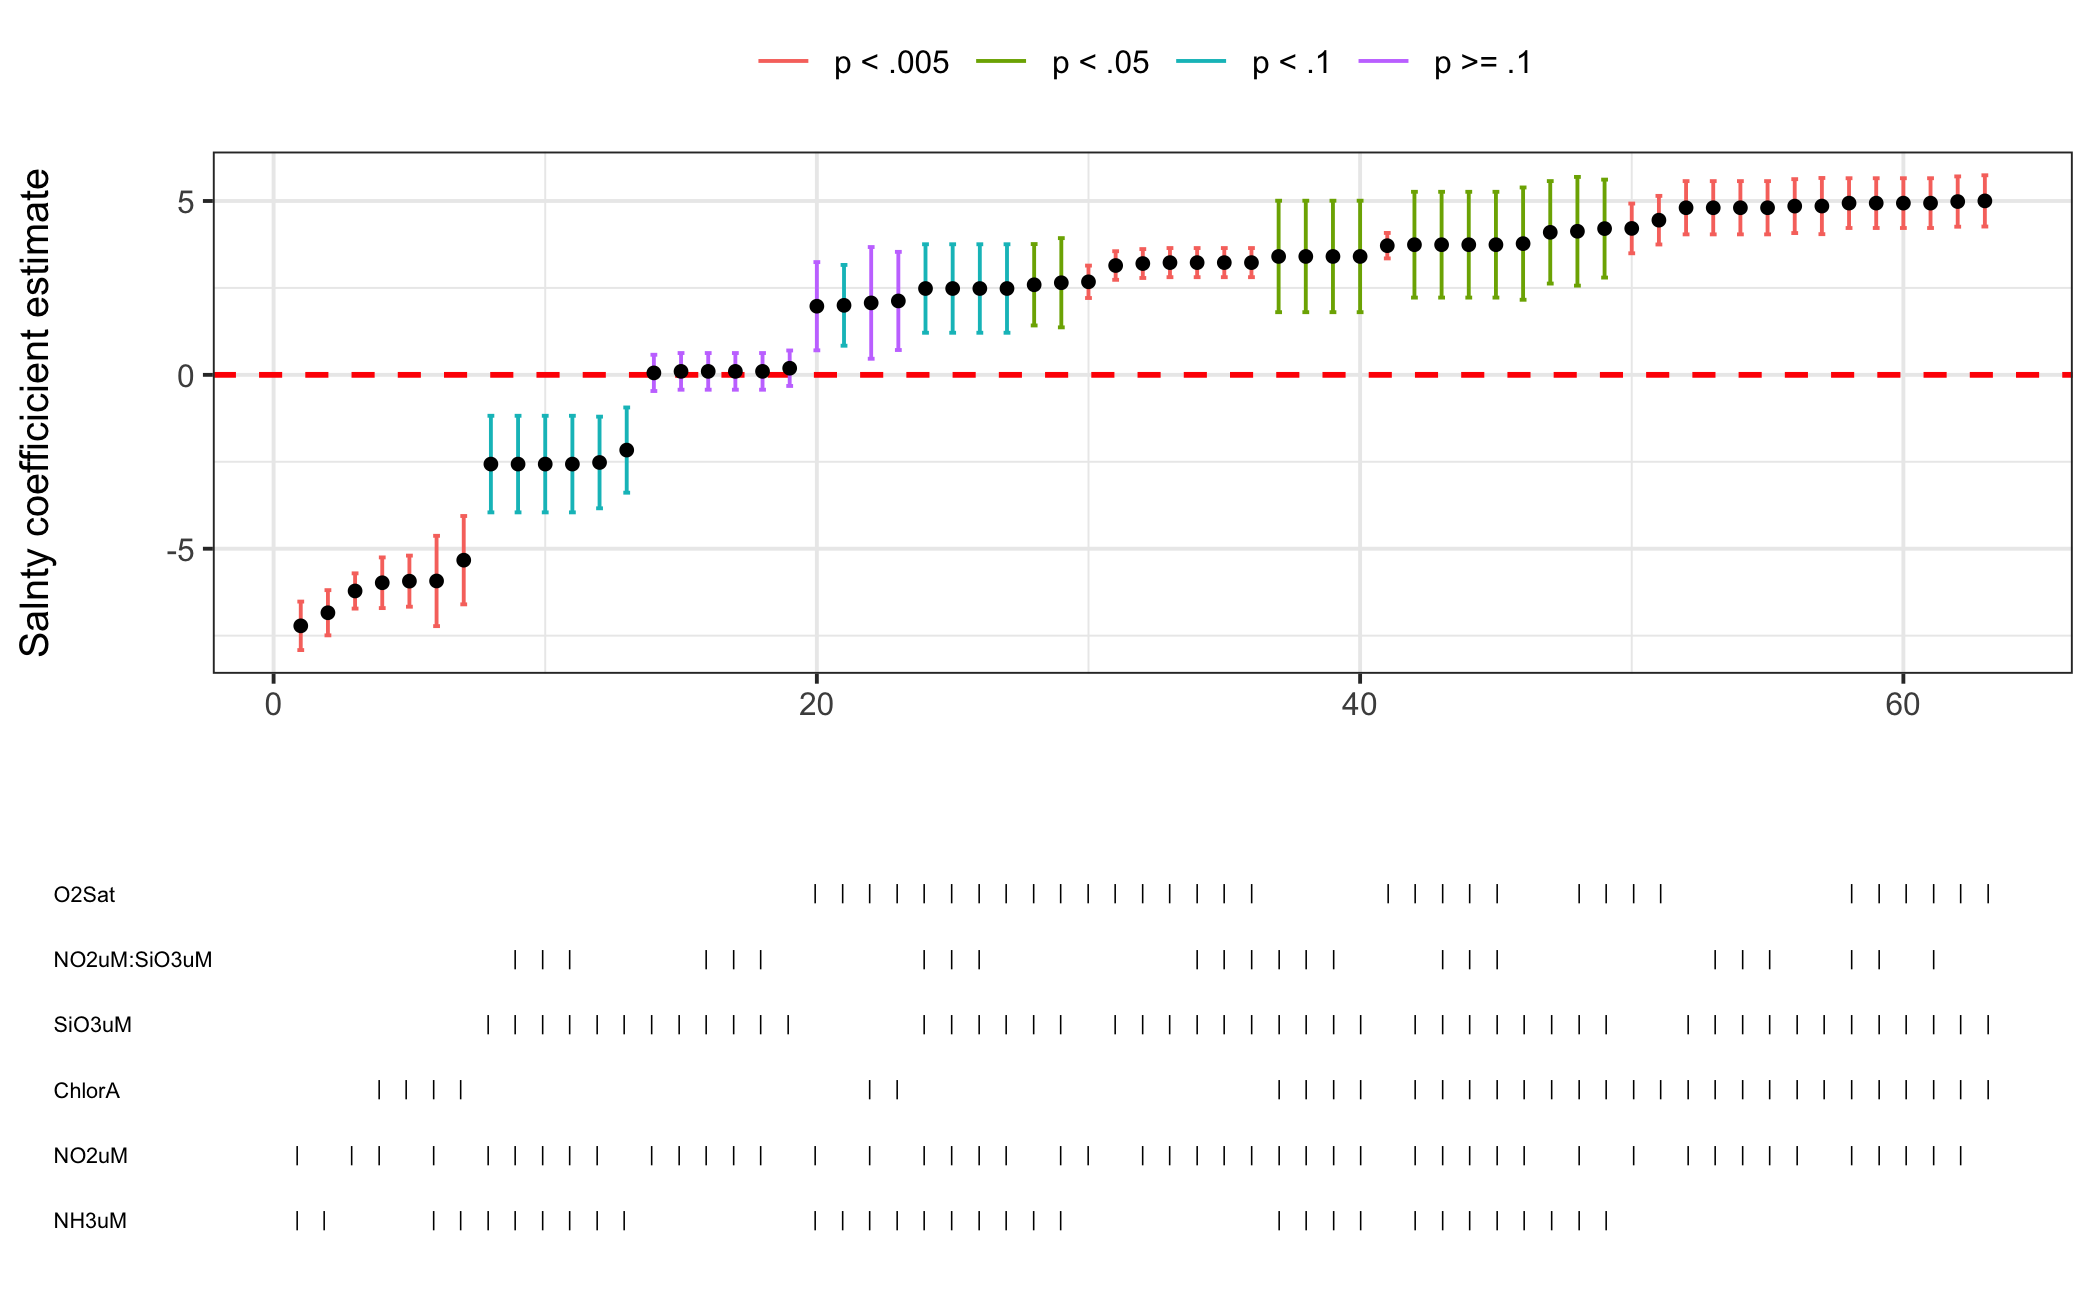
Figure 2.1: Example Specification Curve
In its most basic form SCA is the process of systematically estimating different specifications (most often varying which control variables are included) and plotting model estimates and/or fit statistics across specifications (Simonsohn, Simmons, and Nelson 2015). Figure 2.1 shows a plot of this kind for a regression using a sample of data from the CalCOFI Bottle Database. The lower pane indicates which control variables are present in a given model and the top pane plots the coefficient estimate for our independent variable for each specification. In this case we can see that our coefficient estimate drastically changes, both in direction and significance, as we change the model specification–if we presented only the rightmost model with a positive, significant coefficient we would misrepresent what is actually happening in the data. The primary purpose of SCA is to test robustness and sensitivity–your model may spit out an estimate for your independent variable with \(p<0.05\) but if you have 6 possible control variables and thus \(2^6=64\) possible models we would expect \(0.05\times64\approx3\) models to have a significant coefficient on the independent variable when there is no true effect.
The ethicist reader by now sees we are venturing into the world of p-hacking, a dark art for researchers of all quantitative disciplines. There is a sense in which SCA can enable p-hacking by helping you cherry pick a specification with your desired (i.e. publishable) result, but its intended use is to avoid unintentionally p-hacking, making the researcher aware of how robust a finding really is. Like open source software, SCA is a double-edged sword relying on the good will of users to make it work as intended. Thinking carefully about what you’re testing with it and how the results can inform your research design are key to making proper use of this powerful tool. Before moving on to package development it should be noted that SCA is not limited only to comparing coefficient estimates across models. It is a broad framework for identifying all the possible specifications the researcher feels are justified and pitting them against each other. In my view, as methodologists publish a new estimator for difference-in-differences every other week, the sheer amount of methods available for researchers to test hypotheses will only make SCA more valuable in the coming years.
3 Part 2: Developing a Solution
My first encounter with SCA was a graduate political science course called Social Science Replication taught by Professor Gareth Nellis at UC-San Diego. An assignment involved performing a SCA for which the professor provided us some code, saying the off-the-shelf packages weren’t all that great. Not feeling like modifying someone else’s code to get the final plot looking how I wanted, I looked into the only SCA package available at the time–specr. My biggest gripe was their use of base R plots which aren’t exactly the prettiest ducklings and for which customization is a confusing hassle.2 Begrudgingly, I took the professor’s code and took the time to modify it for my liking.
Fast forward a year or so and I was doing exploratory analysis of results for a YouGov survey I fielded with a peer, Jen Gaudette. I had a result that seemed sensitive to model specification and so I sought to dig up the code I had modified . . . but I couldn’t find it. At this point, perhaps in part trying to avoid doing my actual research, I decided to rewrite it and this time make it into a proper R package. By this point I did have some experience creating a package, having developed plotness, a package for Poissonness and binomialness plots for Poisson and binomial regression models. This package, however, largely recycled the code of the vcd::distplot() function and, though I made an effort to follow CRAN best practices, was never submitted to CRAN. This time I wanted to build a package from the ground up with the intention of it providing value to others.
In the following section I’ll walk through the development of a simplified SCA function to demonstrate the basic thought process when developing a package (or really any code) to solve a problem.
3.1 Simple SCA
At the most basic level a SCA package needs a function that estimates a series of models specified by the user. That is, it needs to take in the specifications of the models (and the data they are estimated with) and output the estimated models, something like this:
# Function to perform specification curve analysis
my_sca() <- function(formulae, data){

  models <- c()

  for(formula in formula){
    models <- c(models, lm(formula, data))
  }

  return(models)
}
where my_sca() is taking in a vector of formulae (i.e. c("Y ~ X1", "Y ~ X1 + X2", "Y ~ X1 + X2 + X3")) and a data frame containing the variables in the formulae. The function loops over the formulae and estimates a model for each before returning the models.
This works but is inefficient so the next step is to vectorize model estimation:3
# Function to perform specification curve analysis
my_sca <- function(formulae, data){

  models <- lapply(formulae, FUN=function(x) lm(x, data=data))

  return(models)
}
where instead of sequentially looping through the list of formulae, we pass an anonymous function to lapply() which is applied to each formula in formulae.4
Ostensibly, this snippet of code is all a user needs to conduct a SCA (setting aside actually visualizing the results). However, neither the input nor output of my_sca() are particularly user-friendly. What steps can we take to improve them?
Right now the user has to manually type out the formula for every regression they wish to run, clearly a hassle. Instead of having the user pass a vector of formulae, we can have them pass three arguments: the dependent variable, the independent variable, and control variables. From these we can then construct formulae with every possible combination of control variables.
Right away we should realize something–the code to construct these formulae doesn’t belong in our SCA function, rather we should put it in a helper function that my_sca() can call. Why do we want to do this? Encapsulation–the principle of bundling related code together for organization and scoping purposes. Put simply, my_sca() is a function that performs specification curve analysis, its job is not to generate a vector of possible formulae. In the process of writing code to come up with every combination of controls we are going to need to create temporary variables and who knows what else that my_sca() has no need for, unnecessarily cluttering the function and making the code less comprehensible. With that decided let’s make the skeleton of our helper function:
# Function to generate a formulae with every possible unique combination
# of controls
my_formula_builder <- function(y, x, controls){
  # DO STUFF
  return(formulae)
}

# Function to perform specification curve analysis
my_sca <- function(y, x, controls, data){

  formulae <- my_formula_builder(y, x, controls)

  models <- lapply(formulae, FUN=function(x) lm(x, data=data))

  return(models)
}
where y and x will be strings with the names of our dependent and independent variables, respectively, and controls will be a vector of control variable names. Once we get the helper working, we can generate the formulae in a single line of code within my_sca().
Now we need to figure out how to get that helper working. We know that in every formula we will have the same dependent and independent variable, it’s only the controls we are varying. What we need to get is every unique subset of the set of control variables–in set theory terminology this is called the power set (though we will exclude the empty set). If our controls are \(\{A, B, C\}\) then the power set is \(\{[A]; [B]; [C]; [A, B]; [B, C]; [C, A]; [A, B, C]\}\).
We could write code to generate the power set from scratch, however base R provides us with combn(x, m) which generates “all combinations of the elements of x taken m at a time” (R-core 2019). There’s no need to re-invent the wheel, especially when we won’t be adding any other packages as dependencies to include this. There is a hiccup though: we want to generate every combination of controls regardless of how many elements are in the subset. That is, we want the argument m to be any value from 1 up to the number of controls we have. We could, of course, solve this with a for loop but let’s jump straight to using lapply():
# Function to generate a formulae with every possible unique combination
# of controls
my_formula_builder <- function(y, x, controls){

  # Apply combn to controls for each possible subset length
  powerset <- lapply(X=1:length(controls),
                            FUN=combn,
                            x=controls,
                            simplify=FALSE)
  return(powerset)
}

# Test case
my_formula_builder(y="Y", x="X", controls=c("A", "B", "C"))
## [[1]]
## [[1]][[1]]
## [1] "A"
##
## [[1]][[2]]
## [1] "B"
##
## [[1]][[3]]
## [1] "C"
##
##
## [[2]]
## [[2]][[1]]
## [1] "A" "B"
##
## [[2]][[2]]
## [1] "A" "C"
##
## [[2]][[3]]
## [1] "B" "C"
##
##
## [[3]]
## [[3]][[1]]
## [1] "A" "B" "C"Now that we are getting the desired output we need to deal with the fact that lapply() is returning a nested list with an extra layer of list where each element is a list of lists of the same size–we just want a list where each element is a subset so we nest the expression in unlist():
# Function to generate a formulae with every possible unique combination
# of controls
my_formula_builder <- function(y, x, controls){

  # Apply combn to controls for each possible subset length
  powerset <- unlist(lapply(X=1:length(controls),
                            FUN=combn,
                            x=controls,
                            simplify=FALSE),
                     recursive=FALSE) # set recursive to FALSE so we only
                                      # remove the first layer of lists
  return(powerset)
}

# Test case
my_formula_builder(y="Y", x="X", controls=c("A", "B", "C"))
## [[1]]
## [1] "A"
##
## [[2]]
## [1] "B"
##
## [[3]]
## [1] "C"
##
## [[4]]
## [1] "A" "B"
##
## [[5]]
## [1] "A" "C"
##
## [[6]]
## [1] "B" "C"
##
## [[7]]
## [1] "A" "B" "C"We have the power set of controls ready to go, now we have to actually construct the formula expressions. This requires just a few lines of string manipulation. First we construct the right-hand side of the formula by applying an anonymous function to each element of the power set that pastes them together separated by plus signs. In this case using an anonymous function (a function we never assign a name) is preferable to creating another helper since it will only be used once and is relatively concise. With the right-hand side created, we can then paste the dependent variable onto the left-hand side of each formula and we’re done:
# Function to generate a formulae with every possible unique combination
# of controls
my_formula_builder <- function(y, x, controls){

  # Apply combn to controls for each possible subset length
  powerset <- unlist(lapply(X=1:length(controls),
                            FUN=combn,
                            x=controls,
                            simplify=FALSE),
                     recursive=FALSE) # set recursive to FALSE so we only
                                      # remove the first layer of lists

  # Create the right-hand side of each formula
  RHS <- sapply(X=powerset,
                function(controls, x){
                  paste(x, paste(controls, collapse=" + "), sep=" + ")
                  }, x=x)

  # Add the dependent variable to the left-hand side of each formula
  formulae <- paste(y, RHS, sep=" ~ ")

  # Coerce each formula (currently a string) to be a formula object
  formulae <- sapply(formulae, as.formula)

  return(formulae)
}

# Test case
my_formula_builder(y="Y", x="X", controls=c("A", "B", "C"))
## $`Y ~ X + A`
## Y ~ X + A
## <environment: 0x10ecb7698>
##
## $`Y ~ X + B`
## Y ~ X + B
## <environment: 0x10ecb7698>
##
## $`Y ~ X + C`
## Y ~ X + C
## <environment: 0x10ecb7698>
##
## $`Y ~ X + A + B`
## Y ~ X + A + B
## <environment: 0x10ecb7698>
##
## $`Y ~ X + A + C`
## Y ~ X + A + C
## <environment: 0x10ecb7698>
##
## $`Y ~ X + B + C`
## Y ~ X + B + C
## <environment: 0x10ecb7698>
##
## $`Y ~ X + A + B + C`
## Y ~ X + A + B + C
## <environment: 0x10ecb7698>Now we can go back to our main function for estimating models and test it out with some mock data and our finished formula builder:
# Function to generate a formulae with every possible unique combination
# of controls
my_formula_builder <- function(y, x, controls){

  # Apply combn to controls for each possible subset length
  powerset <- unlist(lapply(X=1:length(controls),
                            FUN=combn,
                            x=controls,
                            simplify=FALSE),
                     recursive=FALSE) # set recursive to FALSE so we only
                                      # remove the first layer of lists

  # Create the right-hand side of each formula
  RHS <- sapply(X=powerset,
                function(controls, x){
                  paste(x, paste(controls, collapse=" + "), sep=" + ")
                  },
                x=x)

  # Add the dependent variable to the left-hand side of each formula
  formulae <- paste(y, RHS, sep=" ~ ")

  # Coerce each formula (currently a string) to be a formula object
  formulae <- sapply(formulae, as.formula)

  return(formulae)
}

# Function to perform specification curve analysis
my_sca <- function(y, x, controls, data){

  formulae <- my_formula_builder(y, x, controls)

  models <- lapply(formulae, FUN=function(x) lm(x, data=data))

  return(models)
}

# Generate some mock data where Y is a function of X and A
X <- runif(100)
A <- X^2 + 2*runif(100)
B <- rnorm(100)
C <- rnorm(100)
Y <- X + A + rnorm(100, mean=5)

mock_data <- data.frame(Y, X, A, B, C)

# Get models with every combination of controls
output <- my_sca(y="Y", x="X", controls=c("A", "B", "C"), data=mock_data)

# Extract the coefficients across models and print them
print(lapply(output, function(x) x$coefficients))
## $`Y ~ X + A`
## (Intercept) X A
## 5.2659393 0.8322861 0.7328224
##
## $`Y ~ X + B`
## (Intercept) X B
## 5.911361 1.496645 -0.109035
##
## $`Y ~ X + C`
## (Intercept) X C
## 5.9011280 1.5201666 0.0235784
##
## $`Y ~ X + A + B`
## (Intercept) X A B
## 5.2765765 0.8210059 0.7265299 -0.0902061
##
## $`Y ~ X + A + C`
## (Intercept) X A C
## 5.26317177 0.83487164 0.73238768 0.01850536
##
## $`Y ~ X + B + C`
## (Intercept) X B C
## 5.90811891 1.49904998 -0.10797172 0.01870754
##
## $`Y ~ X + A + B + C`
## (Intercept) X A B C
## 5.27430932 0.82313628 0.72624597 -0.08938844 0.01451538This example is, of course, very much simplified and the actual sca() function in the package does much more–allowing for interaction terms, fixed effects, parallelization, etc. It also extracts all the relevant parts of the models and returns them in a readable data frame that can then be used for plotting. But this example demonstrates the basic process of writing a package: aiming to solve a problem and solving numerous little puzzles along the way.
A final note for this example is that I’ve made the code here less concise than it could be (sorry Python people) in order for it be easily comprehensible. Whenever writing code it’s a constant battle to balance conciseness and readability. For example, the body of my_formula_builder() can be written as just one expression:
my_formula_builder <- function(y, x, controls){
  sapply(paste(y, sapply(X=unlist(lapply(X=1:length(controls), FUN=combn,
                                         x=controls, simplify=FALSE),
                                  recursive=FALSE),
                function(controls, x){
                  paste(x, paste(controls, collapse=" + "), sep=" + ")
                  },
                x=x), sep=" ~ "), as.formula)
}
When you become proficient in a language it can be tempting to code like this to flex your skills but when revisiting the code a year from now, or worse yet if someone else ever looks at it, it will be an incomprehensible mess.
4 Part 3: Meeting CRAN Standards
Aside from actually writing the code to solve the problem, ensuring your code meets the standards required by the distribution service, in this case the Comprehensive R Archive Network (CRAN), is going to be one of the more challenging parts of package development. It can feel overwhelming to make sure your documentation is up to snuff and there are no unforeseen bugs you didn’t catch in testing. Thankfully, Wickham and Bryan (2023) provide a fantastic (and free!) online version of their book with a thorough but approachable guide to R package development. Read through this thoroughly before you write any more code, it will pay off in the long run. Along with this guide there are great tools in the devtools, usethis, and roxygen2 packages that automate a fair amount of the testing and documentation you’ll need to do. Being guided through code documentation with roxygen2 skeletons is particularly valuable if you have only added sporadic comments to your code in the past and will make you appreciate the effort developers put into the documentation that, if you’re like me, you’re constantly referring to while coding.
An aspect of development that is perhaps under-explained in Wickham and Bryan (2023) is using Git for version control. Most social scientists, understandably, never interact much with Git, usually living in Dropbox or some other cloud storage service. Speaking from experience, wrapping your head around Git commits, merges, pulls, branches, etc. can be intimidating. I’m grateful to have been exposed to this fairly early on in my undergraduate computer science courses, and even still it can get confusing. While RStudio has integrated support for Git that can make some of this less intimidating, it is definitely worth it to familiarize yourself with the basics of Git repositories before jumping into package development. Make a test repository and play around with push and pull requests, merging branches, etc. It could save you from screwing up a repository with important code in the future.
5 Part 4: SCA in Action
5.1 A fun example with Starbucks
Before trying out SCA on academic data, let’s play around with something less serious. Data Science Learning Community has a great weekly data project challenge called Tidy Tuesday with a load of interesting data sets to play around with. I’m going to use a data set of Starbucks drink nutritional information they provided for week 52 of 2021. This data is a good starting point, but for this example I want to model what nutritional characteristics make some drinks more popular than others. There’s scant (publicly available) data on this from actual sales or opinion polling, but there are a number of listicles ranking Starbucks drinks. I collected drink ranks from five sources:
- TastingTable: 25 Most Popular Starbucks Drinks
- Country Living: The Best Starbucks Drinks of All Time, Ranked
- Thrillist: We Ranked Every Drink on the Starbucks Menu
- Taste of Home: 27 Best Starbucks Drinks
- delish: The 31 Best Starbucks Drinks Of All Time
There are a few problems with using these rankings to measure drink popularity. The first is some of the seasonal drinks ranked are not present in the TidyTuesday data set, however after all is said and done I do have 28 drinks with at least one ranking. The second is if we are using ordinal rankings as the outcome variable, we can’t run an OLS regression–rather we would need to use an ordinal logistic regression. Because this kind of regression isn’t currently supported by speccurvieR (though I hope to add support in the future), I’m going to transform these rankings into a continuous score variable. This, of course, isn’t completely methodologically sound–to do this we have to assume that the distance between ranks 1 and 2 is the same as between 2 and 3, etc. We also need to assume the distribution can be well approximated by a normal distribution, though this is less of an issue when we have ~>10 categories, which we do.
Making these assumptions, I go ahead and convert the ranking for each drink-listicle observation into a score between 0 and 100 as follows:
\[\textrm{score}=100\times\frac{\textrm{[no. of ranks] - [drink rank]}}{\textrm{no. of ranks}}\]
So, for example, TastingTable ranks 35 drinks and places the Iced Caramel Macchiato at #3 so our score is:
\[\textrm{score}=100\times\frac{35-3}{35}=91.4\]
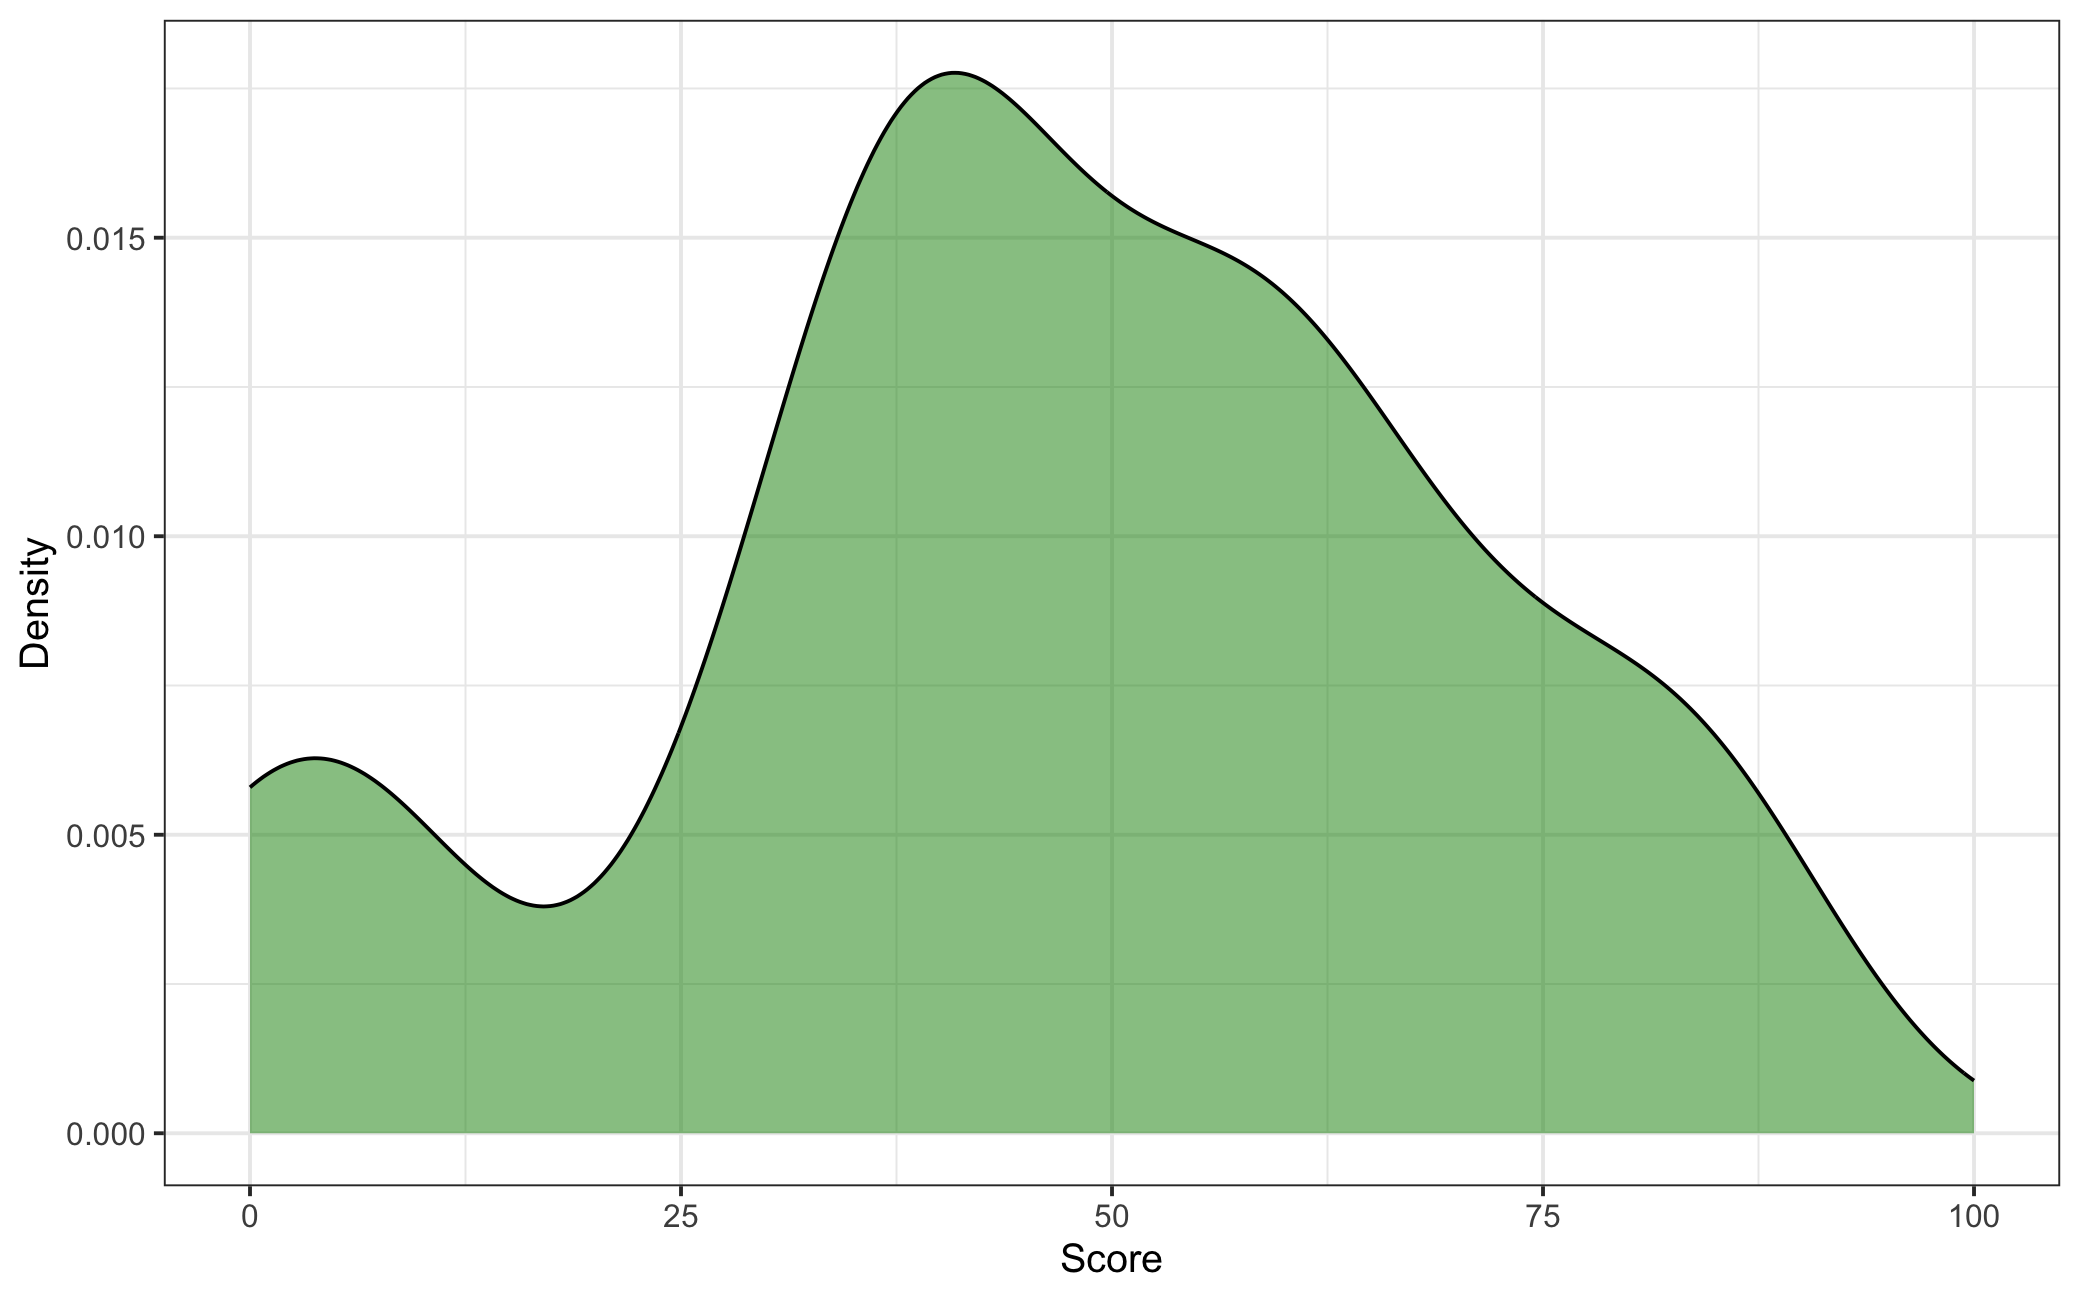
Figure 5.1: Density Plot of Starbucks Drink Scores
We now have a scores at the drink-listicle level but ultimately want just one score per drink, so the final step is to calculate the average score across listicles for each drink, giving us our dependent variable. A quick check of this variable’s distribution in Figure 5.1 shows a roughly normal distribution of scores.
Before estimating our model we need to do one more bit of data cleaning: our Starbucks nutritional data has multiple observations for each drink due to different sizes, units of milk added, and whether or not the customer wants whipped cream. To deal with this I first restrict the data set to only tall drink sizes. I then calculate the mean nutritional values across drink variations to get an estimate that’s roughly representative of that class of drink. Finally, I construct two additional variables–an indicator for whether a drink is iced or not and a count of the number of listicles the drink appears on.
Now that our data is in order we need to think about our model specification, what drink characteristics would we expect to affect their scores? I would expect drinks perceived as tasting better would have more calories, fat, sodium, and sugar. If we also control for whether the drink is iced and the number of listicles it appears on we then have the following model:
\[\textrm{score} = \beta_0 + \beta_1[\textrm{calories}] + \beta_2[\textrm{total fat}] + \beta_3[\textrm{sodium}] + \beta_4[\textrm{sugar}] + \beta_5[\textrm{iced}] + \beta_6[\textrm{no. of listicles}] + \varepsilon\]
| (1) | |
|---|---|
| calories | 0.860+ |
| (0.459) | |
| total fat (g) | −6.372 |
| (6.604) | |
| sodium (mg) | −0.357* |
| (0.169) | |
| sugar (g) | −2.947+ |
| (1.659) | |
| iced | −8.470 |
| (11.243) | |
| no. of listicles | −1.901 |
| (4.408) | |
| Num.Obs. | 28 |
| R2 | 0.307 |
| R2 Adj. | 0.109 |
| F | 1.550 |
| RMSE | 19.63 |
| + p < 0.1, * p < 0.05, ** p < 0.01, *** p < 0.001 |
Table 5.1 reports the results of this regression. Interestingly, the only significant (\(p<.05\)) coefficient is for sodium but it’s in the direction opposite of what was expected: drinks with less sodium scored better controlling for the other nutrients present in the model. Now let’s see if this is robust across model specifications. If sodium really were the ingredient that mattered we would expect it to remain significant and negative even when we use a different set of controls.
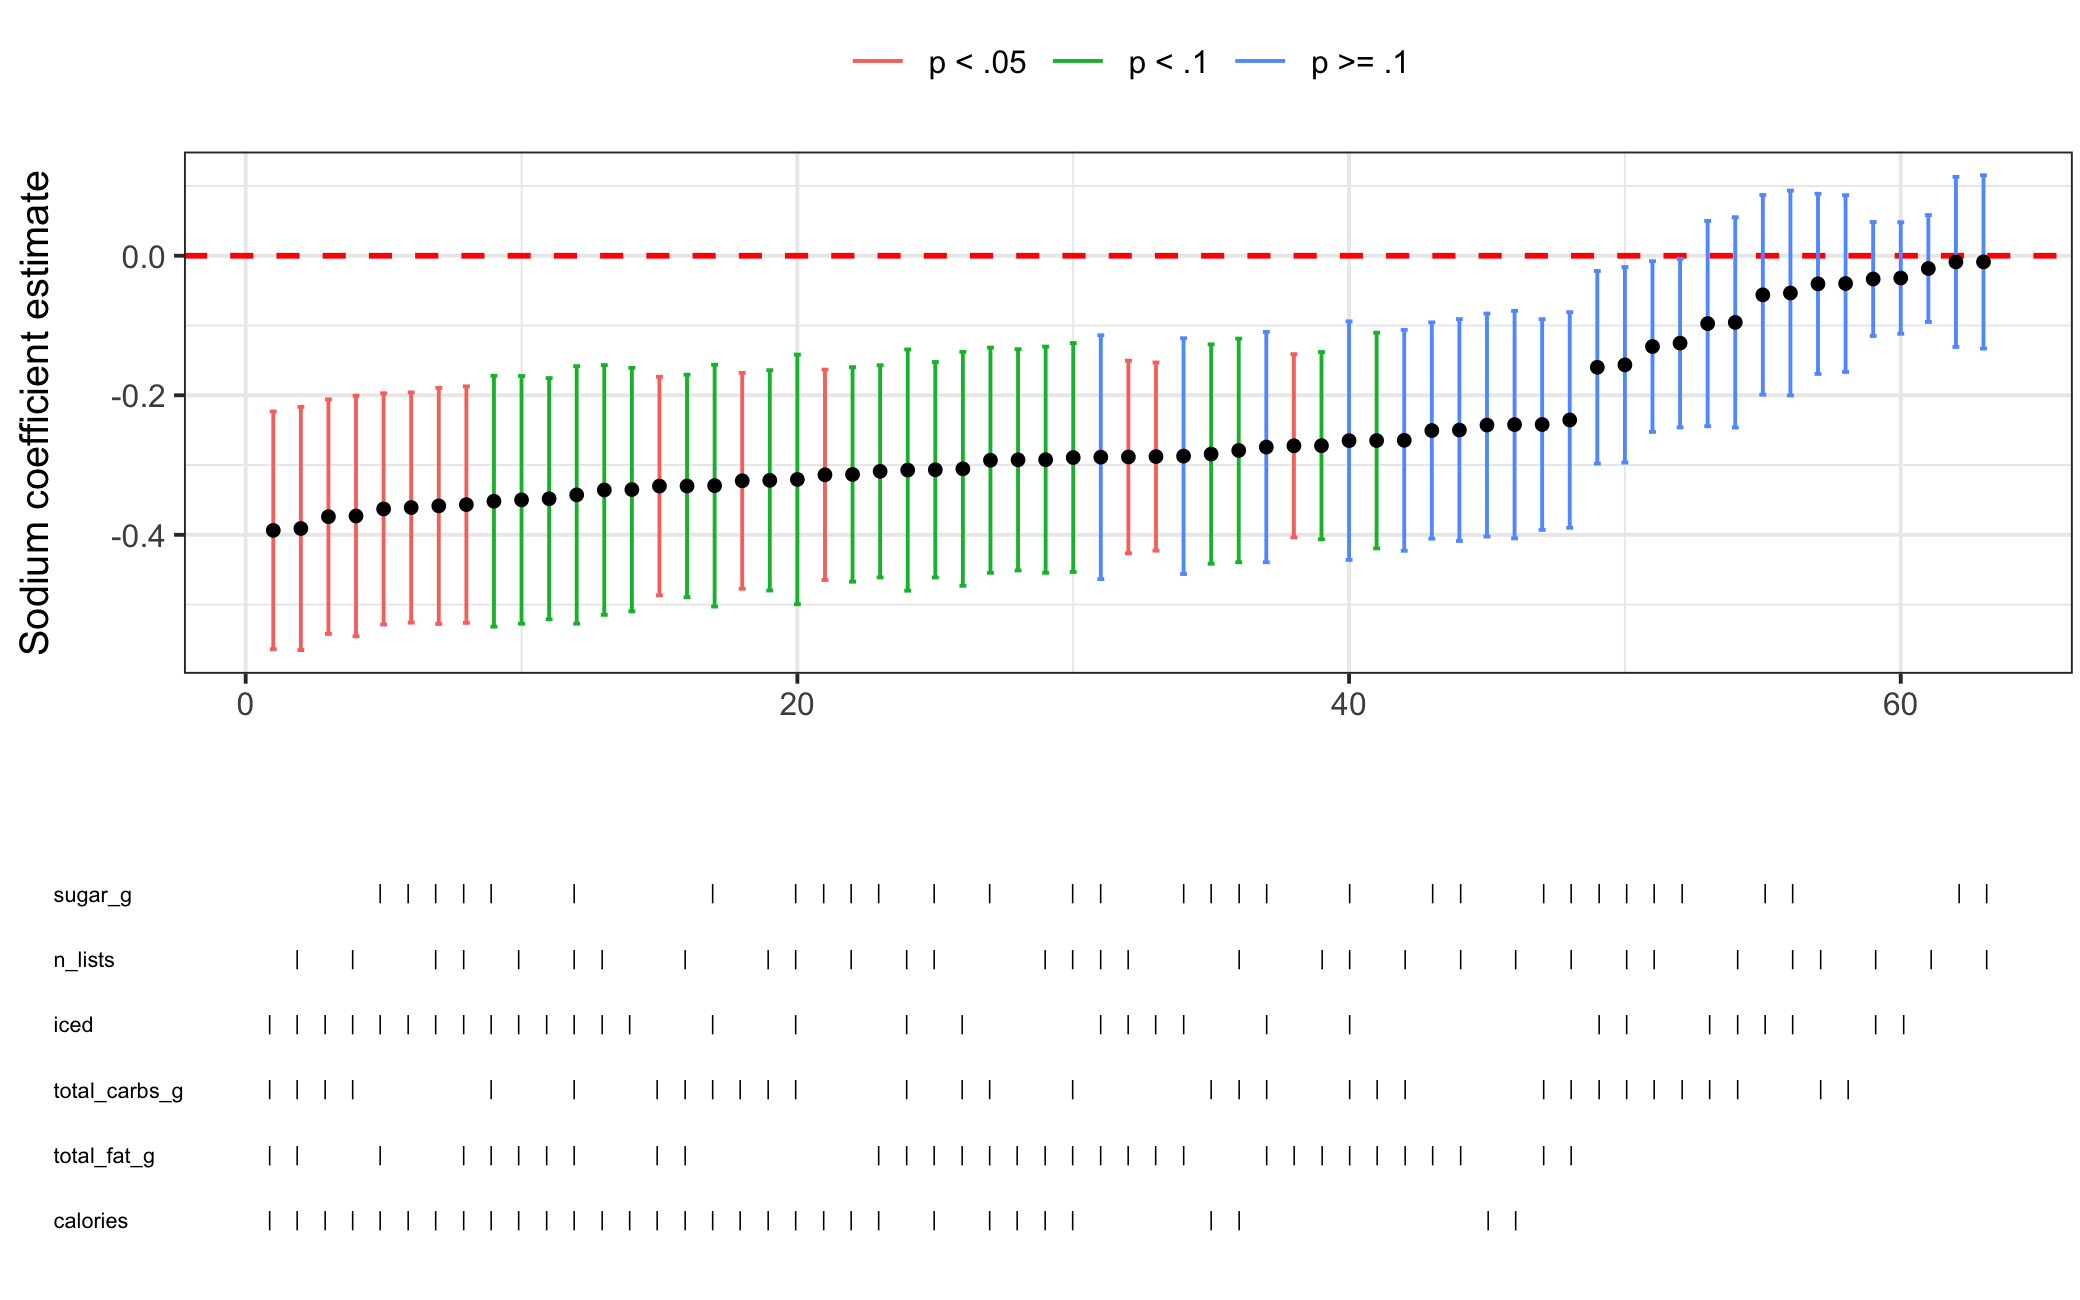
Figure 5.2: Specification Curve Analysis for Starbucks Drink Score Model
Figure 5.2 above shows the specification curve analysis for the above regression model. 14 of the 63 models, or 22%, have significant and negative estimates for the effect of sodium on drink score. This is more than we would expect by chance alone and given that we are working with just 28 observations, the fact that 60% of the models have a borderline (\(p<.1\)) significant coefficient or better lends some credence to our finding above–the result does not appear to be unreasonably sensitive to model specification. As another test, let’s use the no. of listicles control as a weighting variable, i.e. giving greater weight to observations where the drink appears on more listicles.
| (1) | |
|---|---|
| calories | 0.575 |
| (0.539) | |
| total fat (g) | −0.585 |
| (8.259) | |
| sodium (mg) | −0.405* |
| (0.180) | |
| sugar (g) | −2.068 |
| (1.934) | |
| iced | −11.621 |
| (11.438) | |
| Num.Obs. | 28 |
| R2 | 0.349 |
| R2 Adj. | 0.201 |
| F | 2.356 |
| RMSE | 20.27 |
| + p < 0.1, * p < 0.05, ** p < 0.01, *** p < 0.001 |
We can see from Table 5.2 that we get the same result, sodium is negative and significant.
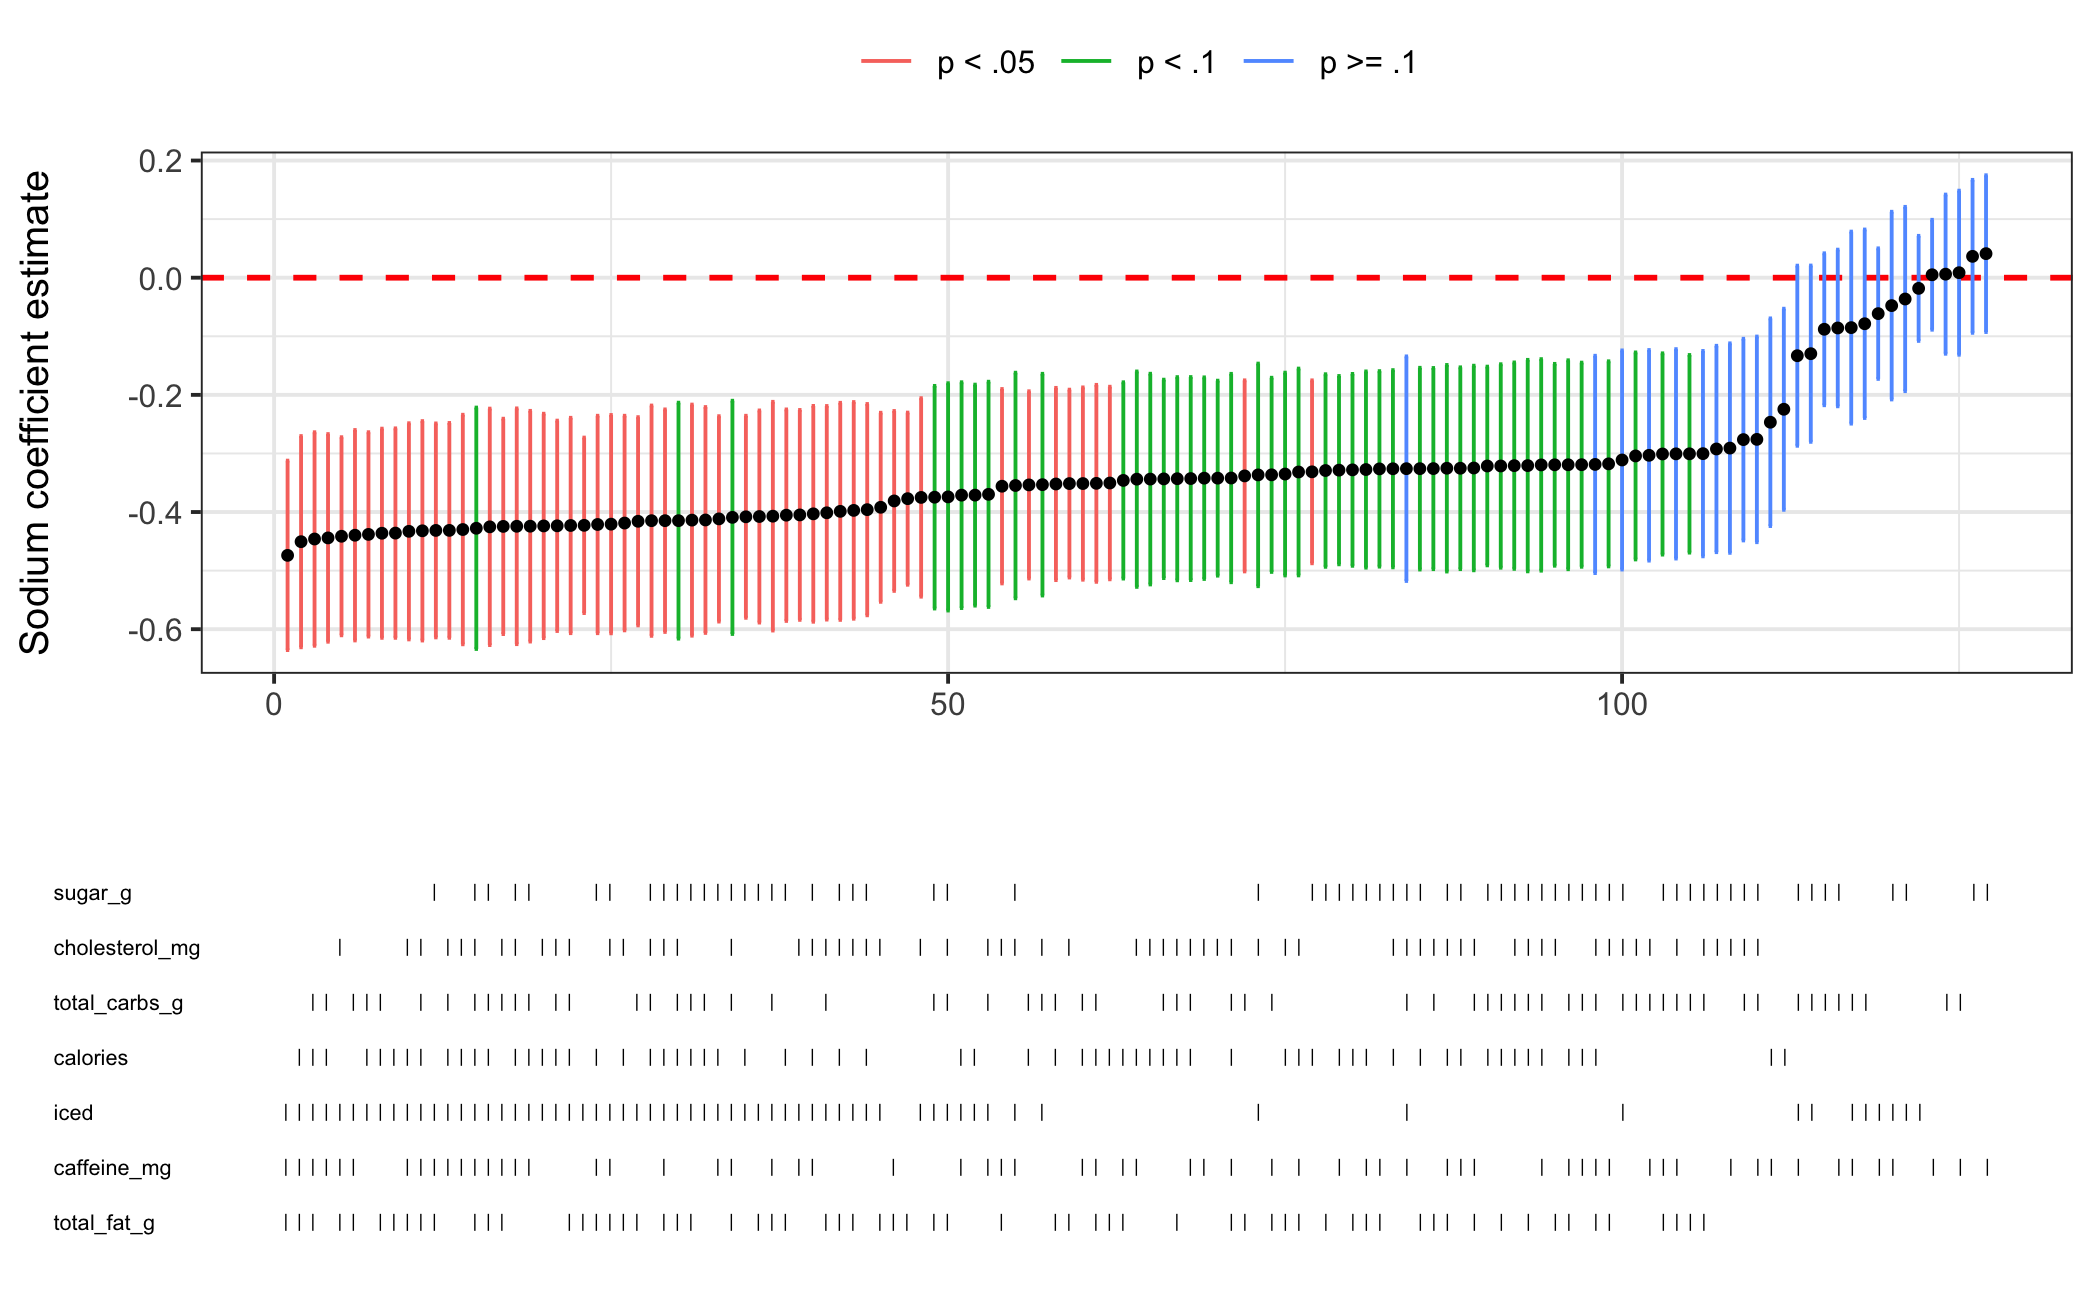
Figure 5.3: Specification Curve Analysis for Starbucks Drink Score Model (weighted)
Running another specification curve analysis with our weighted model in Figure 5.3, we find an even more robust result than before. It seems reasonable to conclude from our results that drinks with less sodium are ranked higher in listicles when controlling for other nutrients.
5.2 A serious example with Mazumder (2018)
Now let’s try out the package on models from an academic journal article. I choose to replicate “The Persistent Effect of U.S. Civil Rights Protests on Political Attitudes” by Soumyajit Mazumder with the replication data provided on Harvard Dataverse. This paper works as an example for several reasons. First, the replication code provided by the author works out of the box–something that was not the case for numerous other studies I attempted to replicate for this section. Second, the models used are supported by my package being OLS regressions with fixed effects. Third, the findings of this paper have important normative implications and so if they are highly sensitive to model specification that is problematic.
With this observational study, Mazumder tries to answer a question that is highly salient in the wake of not only the criminal justice protests in recent years, but the even more recent protests over the Israel-Palestine conflict–protests that have rocked my own university in recent months. Using Cooperative Congressional Election Study data from 2006 to 2011 and Dynamics of Collective Action data on civil rights protests, he tests for correlations between protests at the county-level in the 1960s and individual measures of racial resentment, support for affirmative action, and party identification in the 2000s for White respondents. He finds that individuals in counties that saw a civil rights protest exhibit lower levels of racial resentment, more support for affirmative action, and are more likely to identify as Democrats. He conducts a number of supplementary analyses to support these findings, but I focus on the main models presented in the paper here.
Mazumder specifies three models of similar specification, changing only the outcome variable:
\[Y = \beta_0 + \beta_1[\textrm{protest}] + \boldsymbol{\beta}\boldsymbol{Z} + \mu + \varepsilon\]
where \(\mu\) is state fixed effects and \(\boldsymbol{Z}\) is a series of 1960 controls: percent of the county that is Black, percent urban, the log of the county’s population, the median income, and the average Democratic vote share. Standard errors are HC2 and observations are weighted by sample size.
| Racial Resentment | Affirm. Action | Prop. Democrat | |
|---|---|---|---|
| Model 1 | Model 2 | Model 3 | |
| protest | -0.090** | 0.020* | 0.028* |
| (0.034) | (0.009) | (0.012) | |
| State Fixed Effects | X | X | X |
| 1960 Controls | X | X | X |
| N | 2530 | 2865 | 2865 |
| R-squared | 0.212 | 0.153 | 0.285 |
I first replicate the results in Mazumder’s Table 1 without issue in Table 5.3 above. It’s worth noting that the replication materials for this paper are organized beautifully and made this quite simple to do.
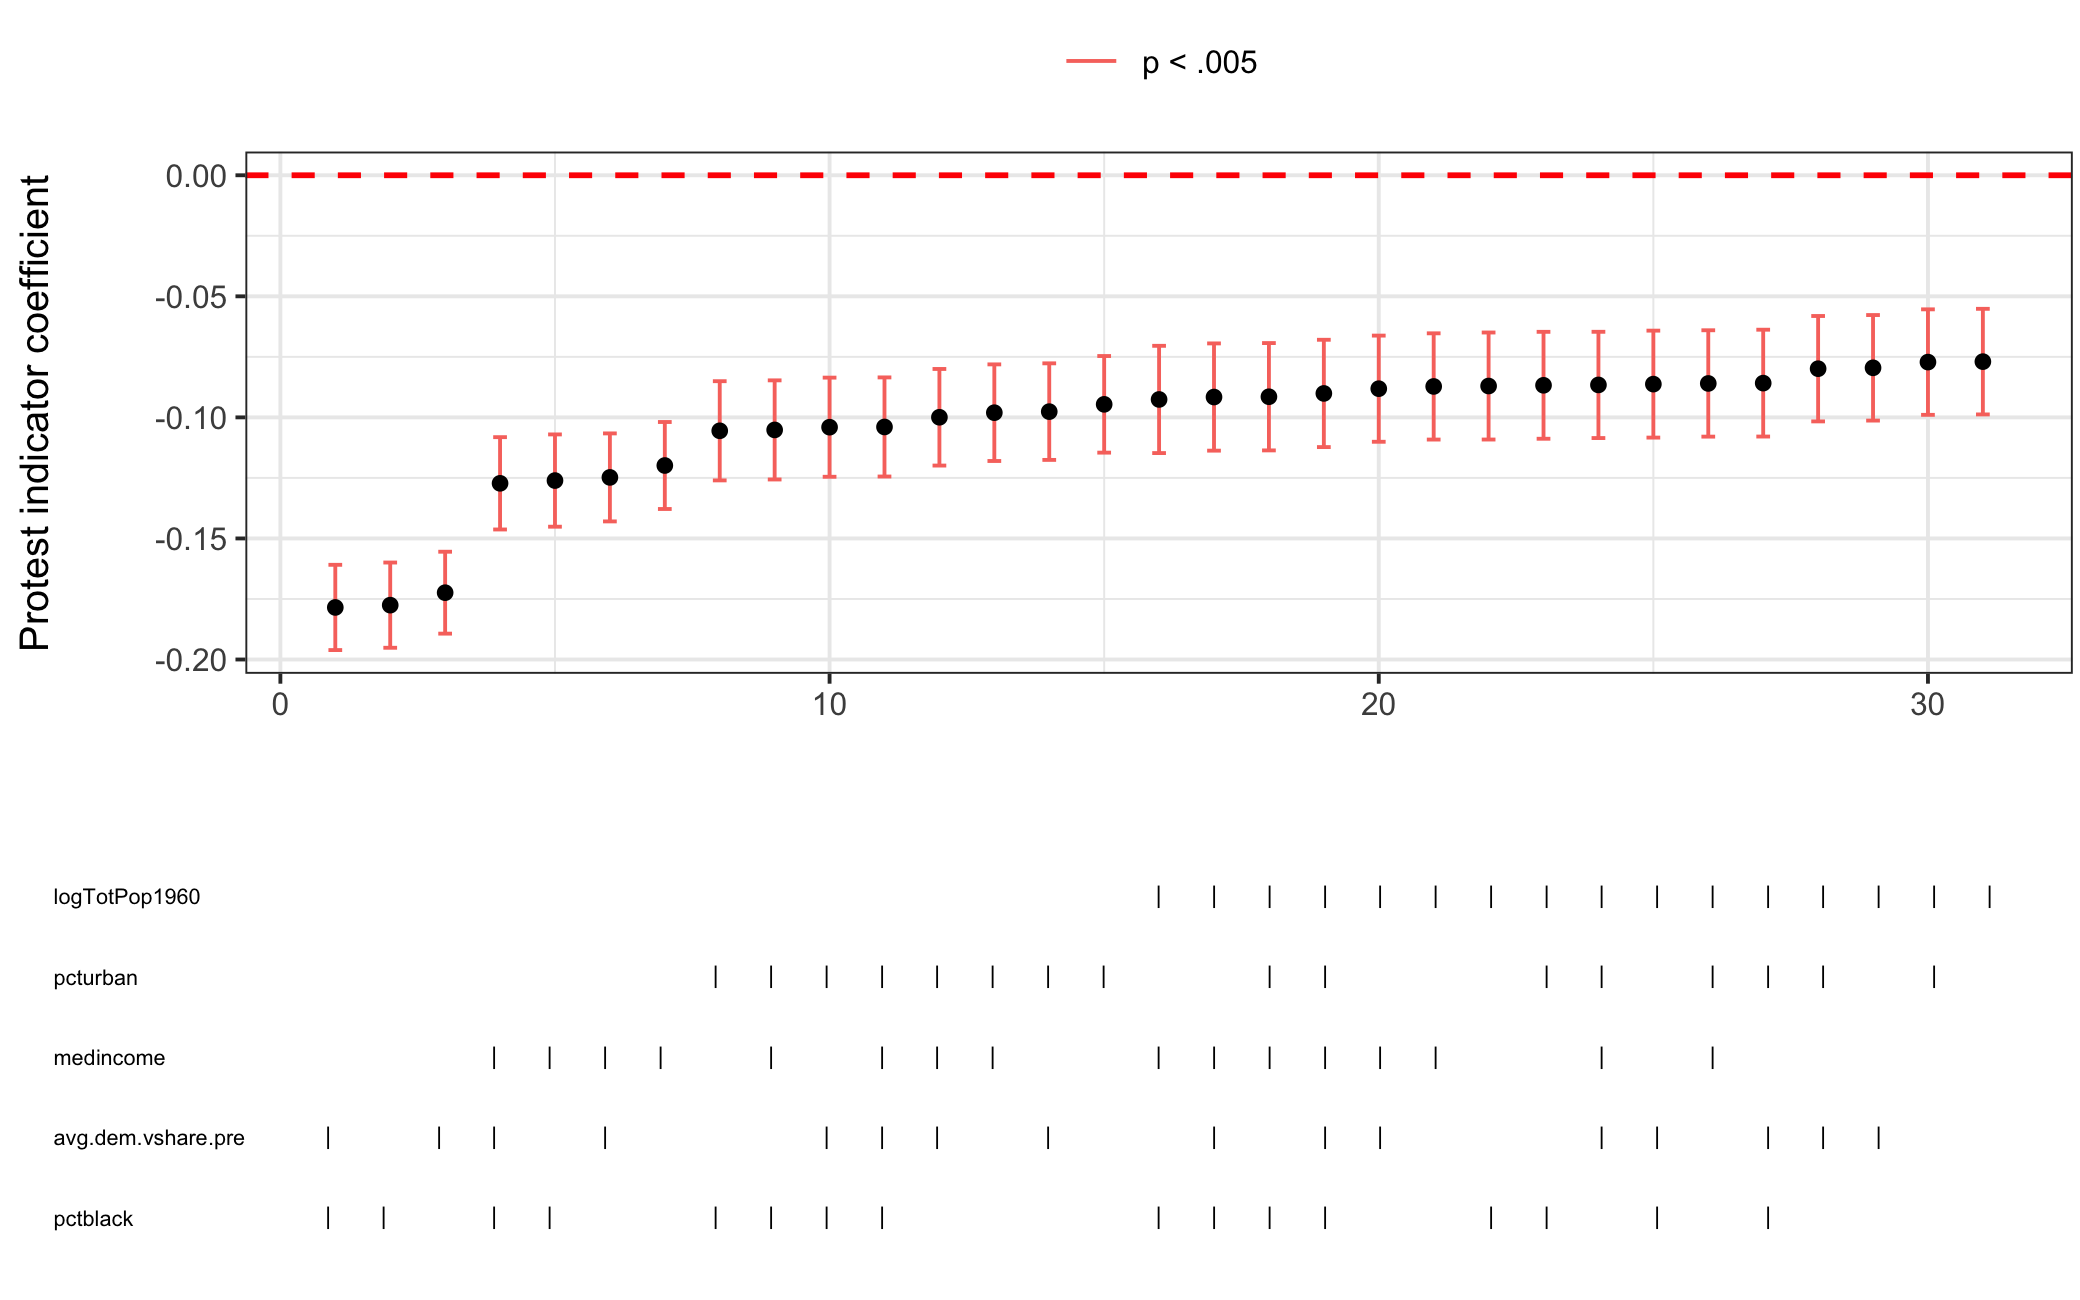
Figure 5.4: Specification Curve Analysis for Racial Resentment Model
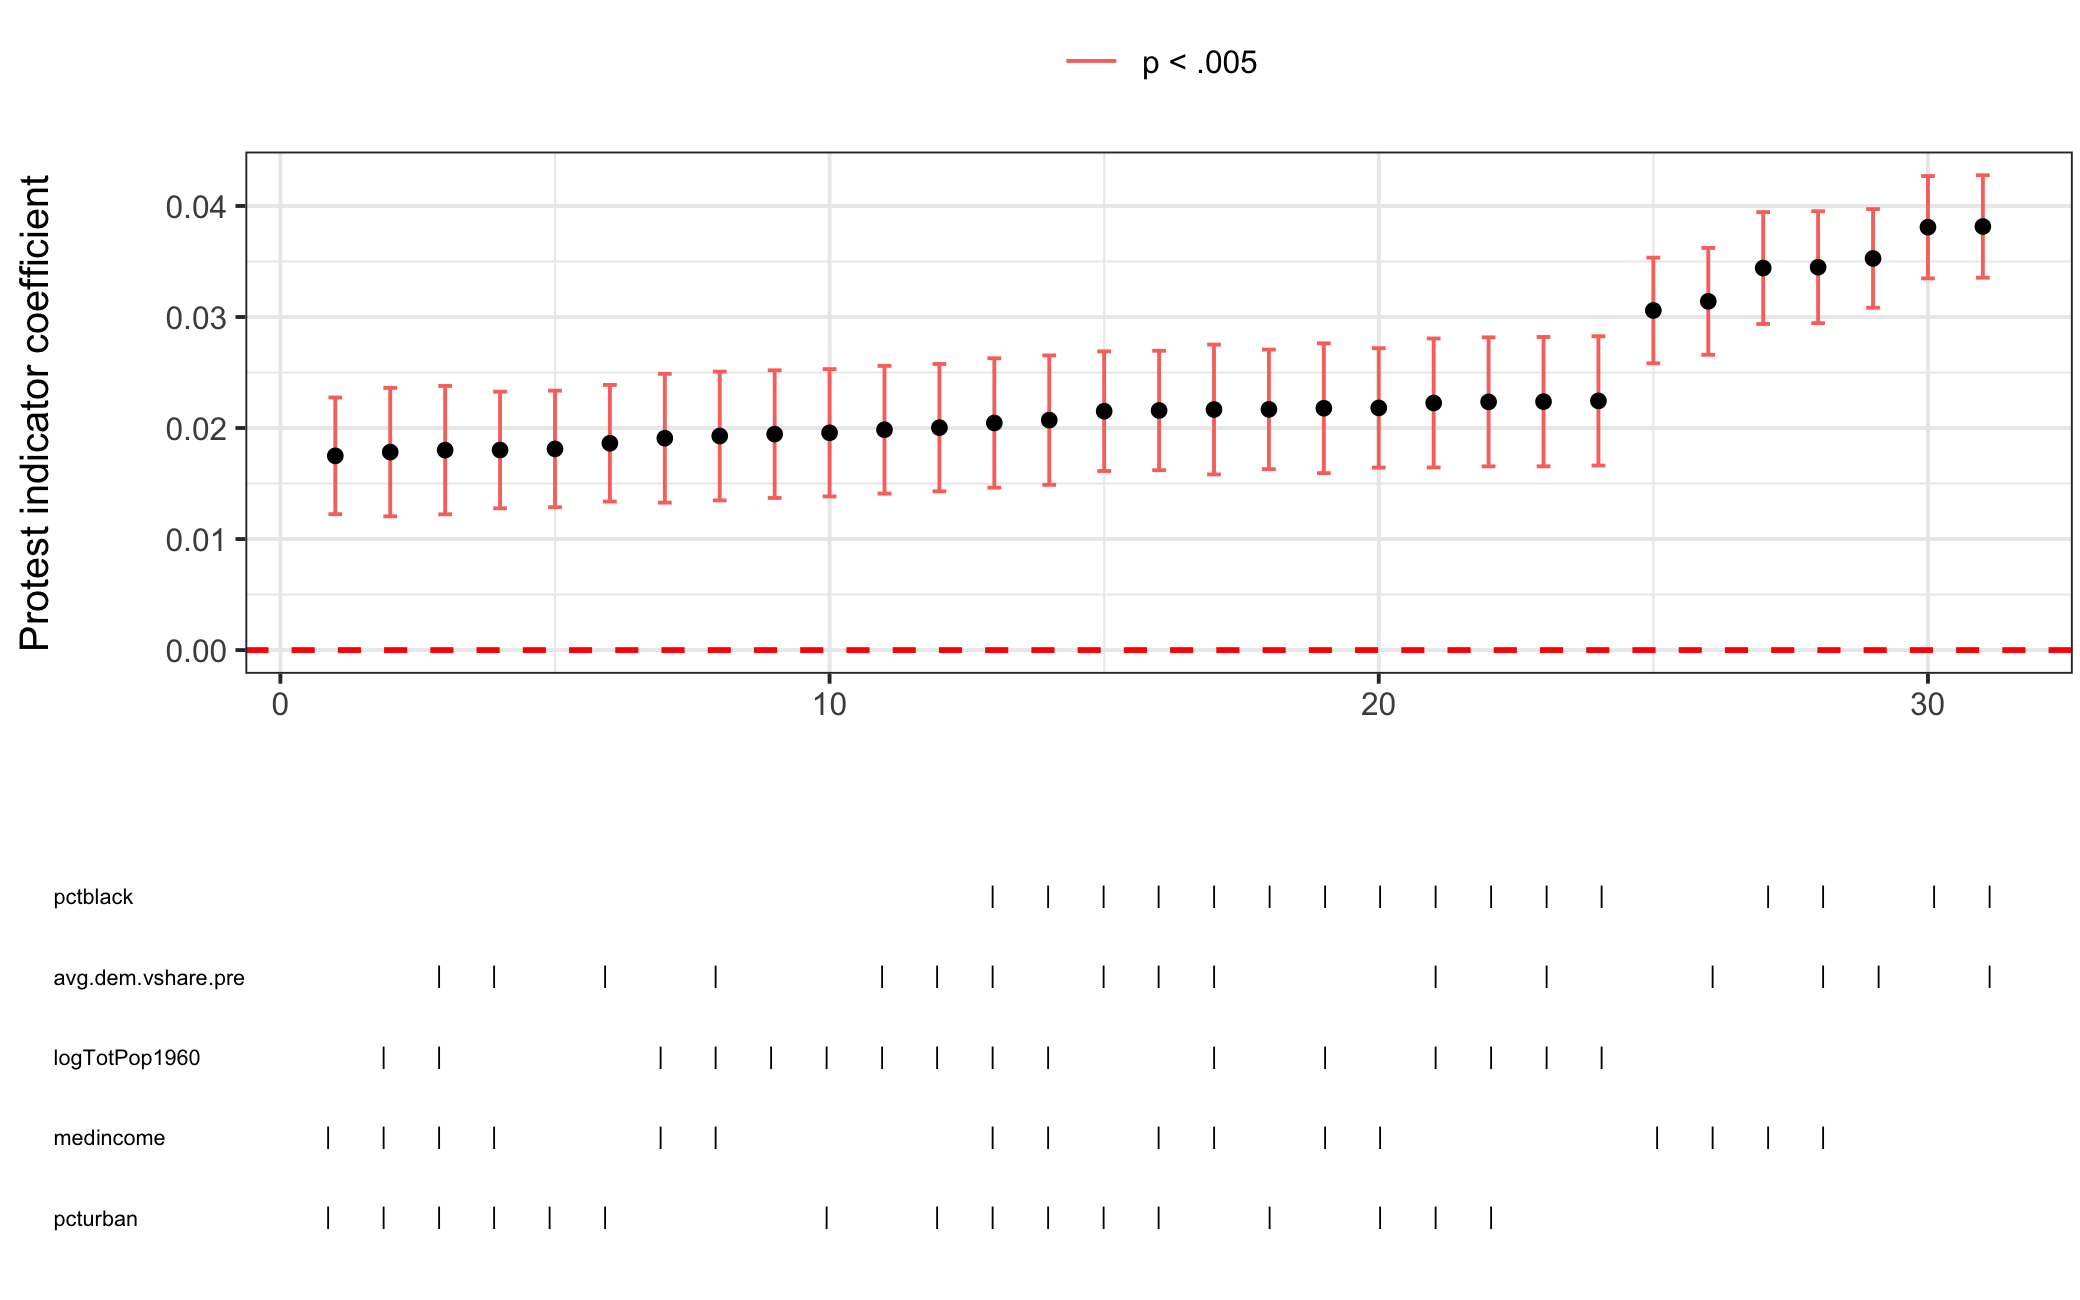
Figure 5.5: Specification Curve Analysis for Affirm. Action Model
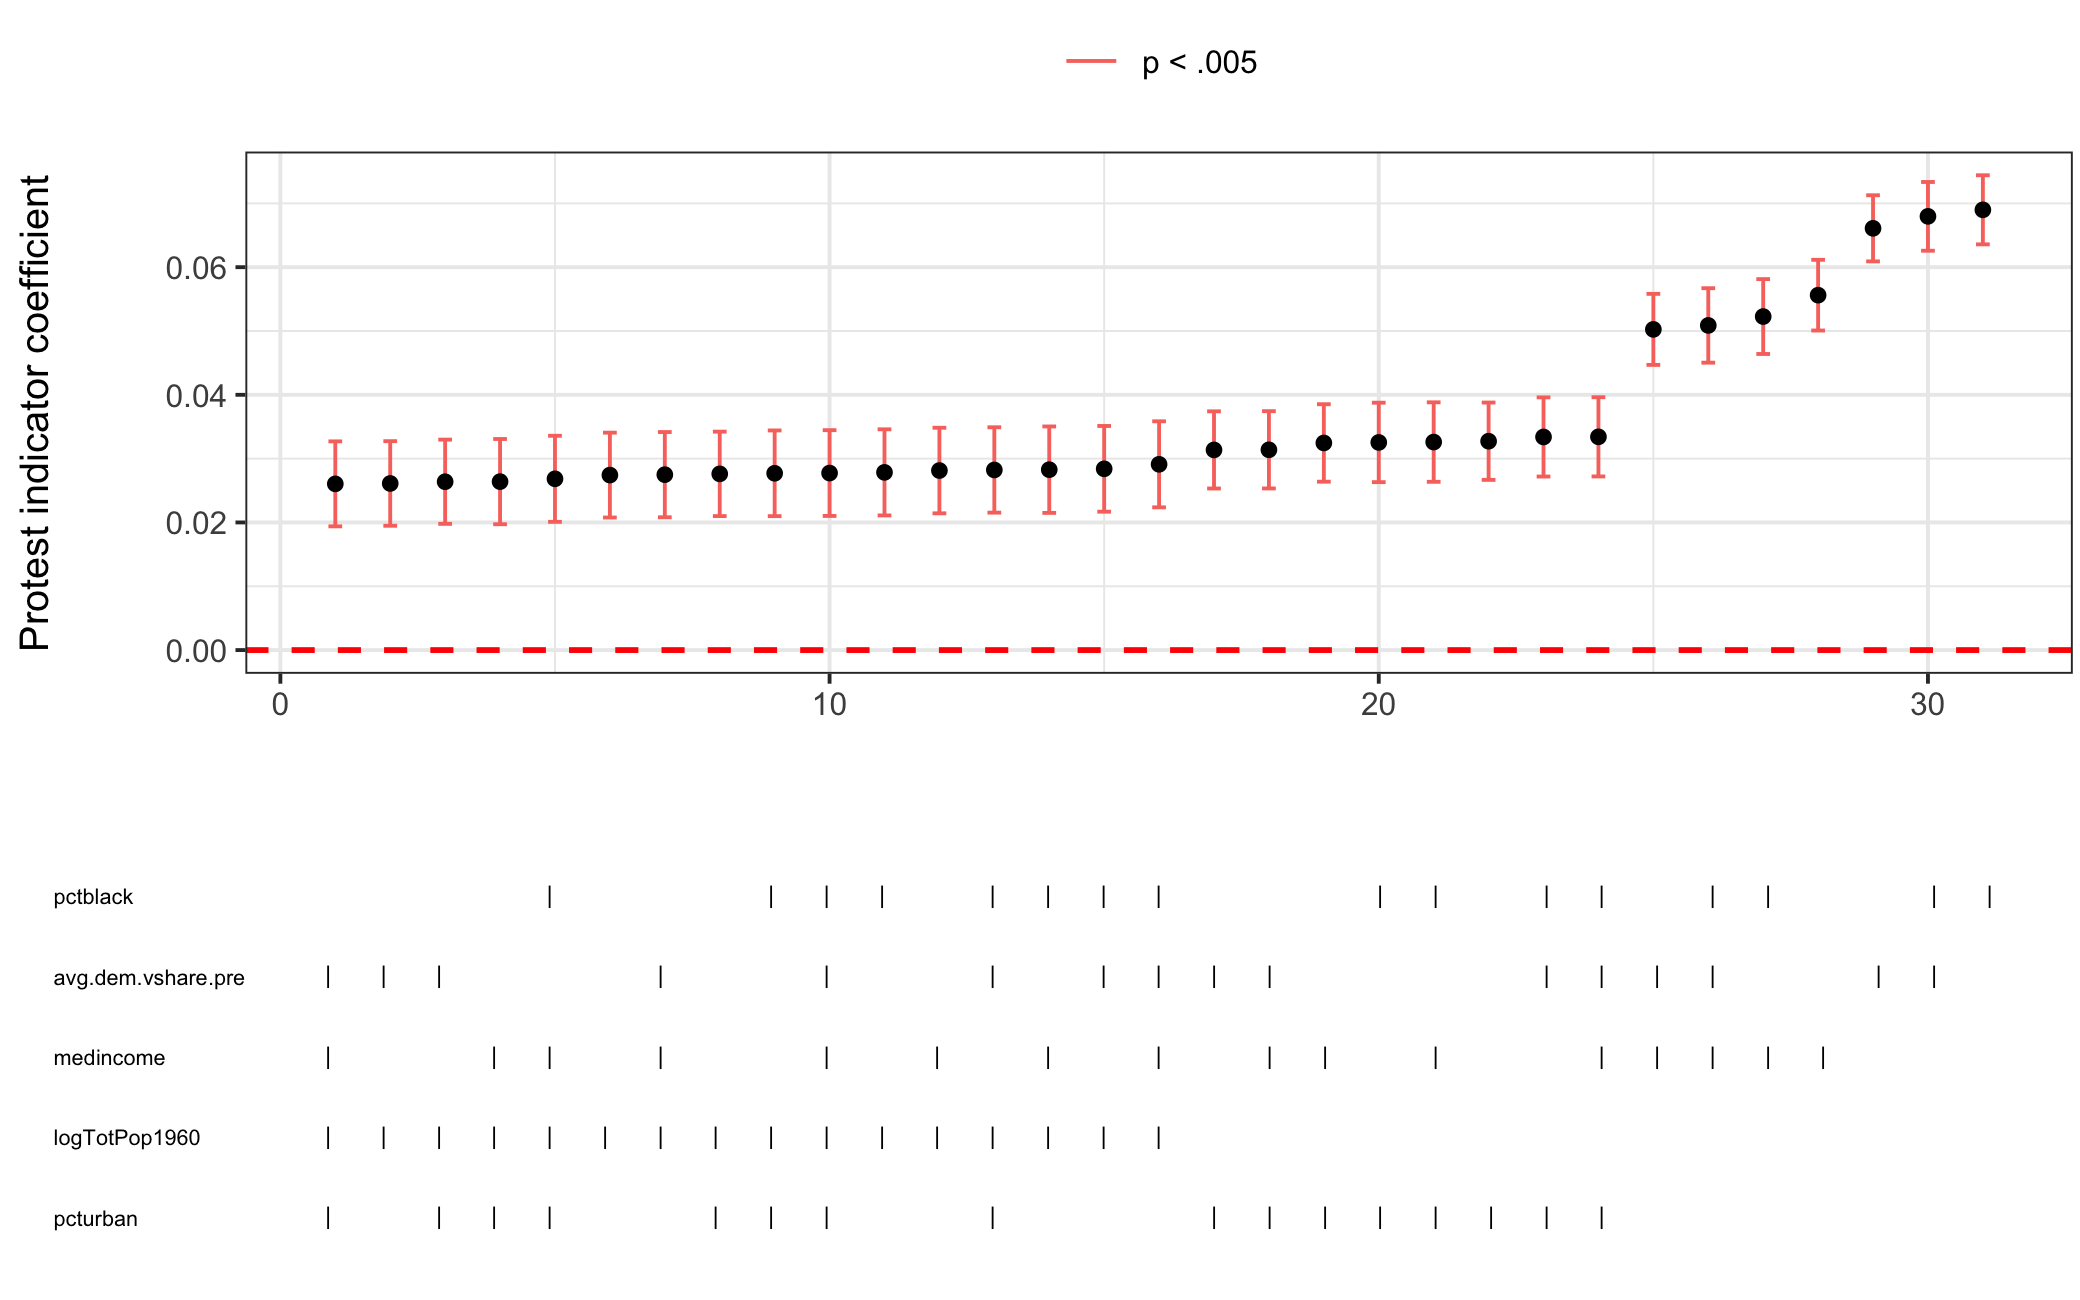
Figure 5.6: Specification Curve Analysis for Prop. Democrat Model
Next, I perform SCA on the three models, shown above in Figures 5.4, 5.5, and 5.6. For all three the protest indicator coefficient is consistently significant and in the same direction across model specifications giving credence to the findings initially reported. It should be noted that the results are yet more impressive when considering that the standard errors reported in the paper are HC2 whereas my package clusters standard errors by the fixed effects variable (in this case state). Knowing this, let’s take a deeper dive into comparing standard error estimates using se_compare().
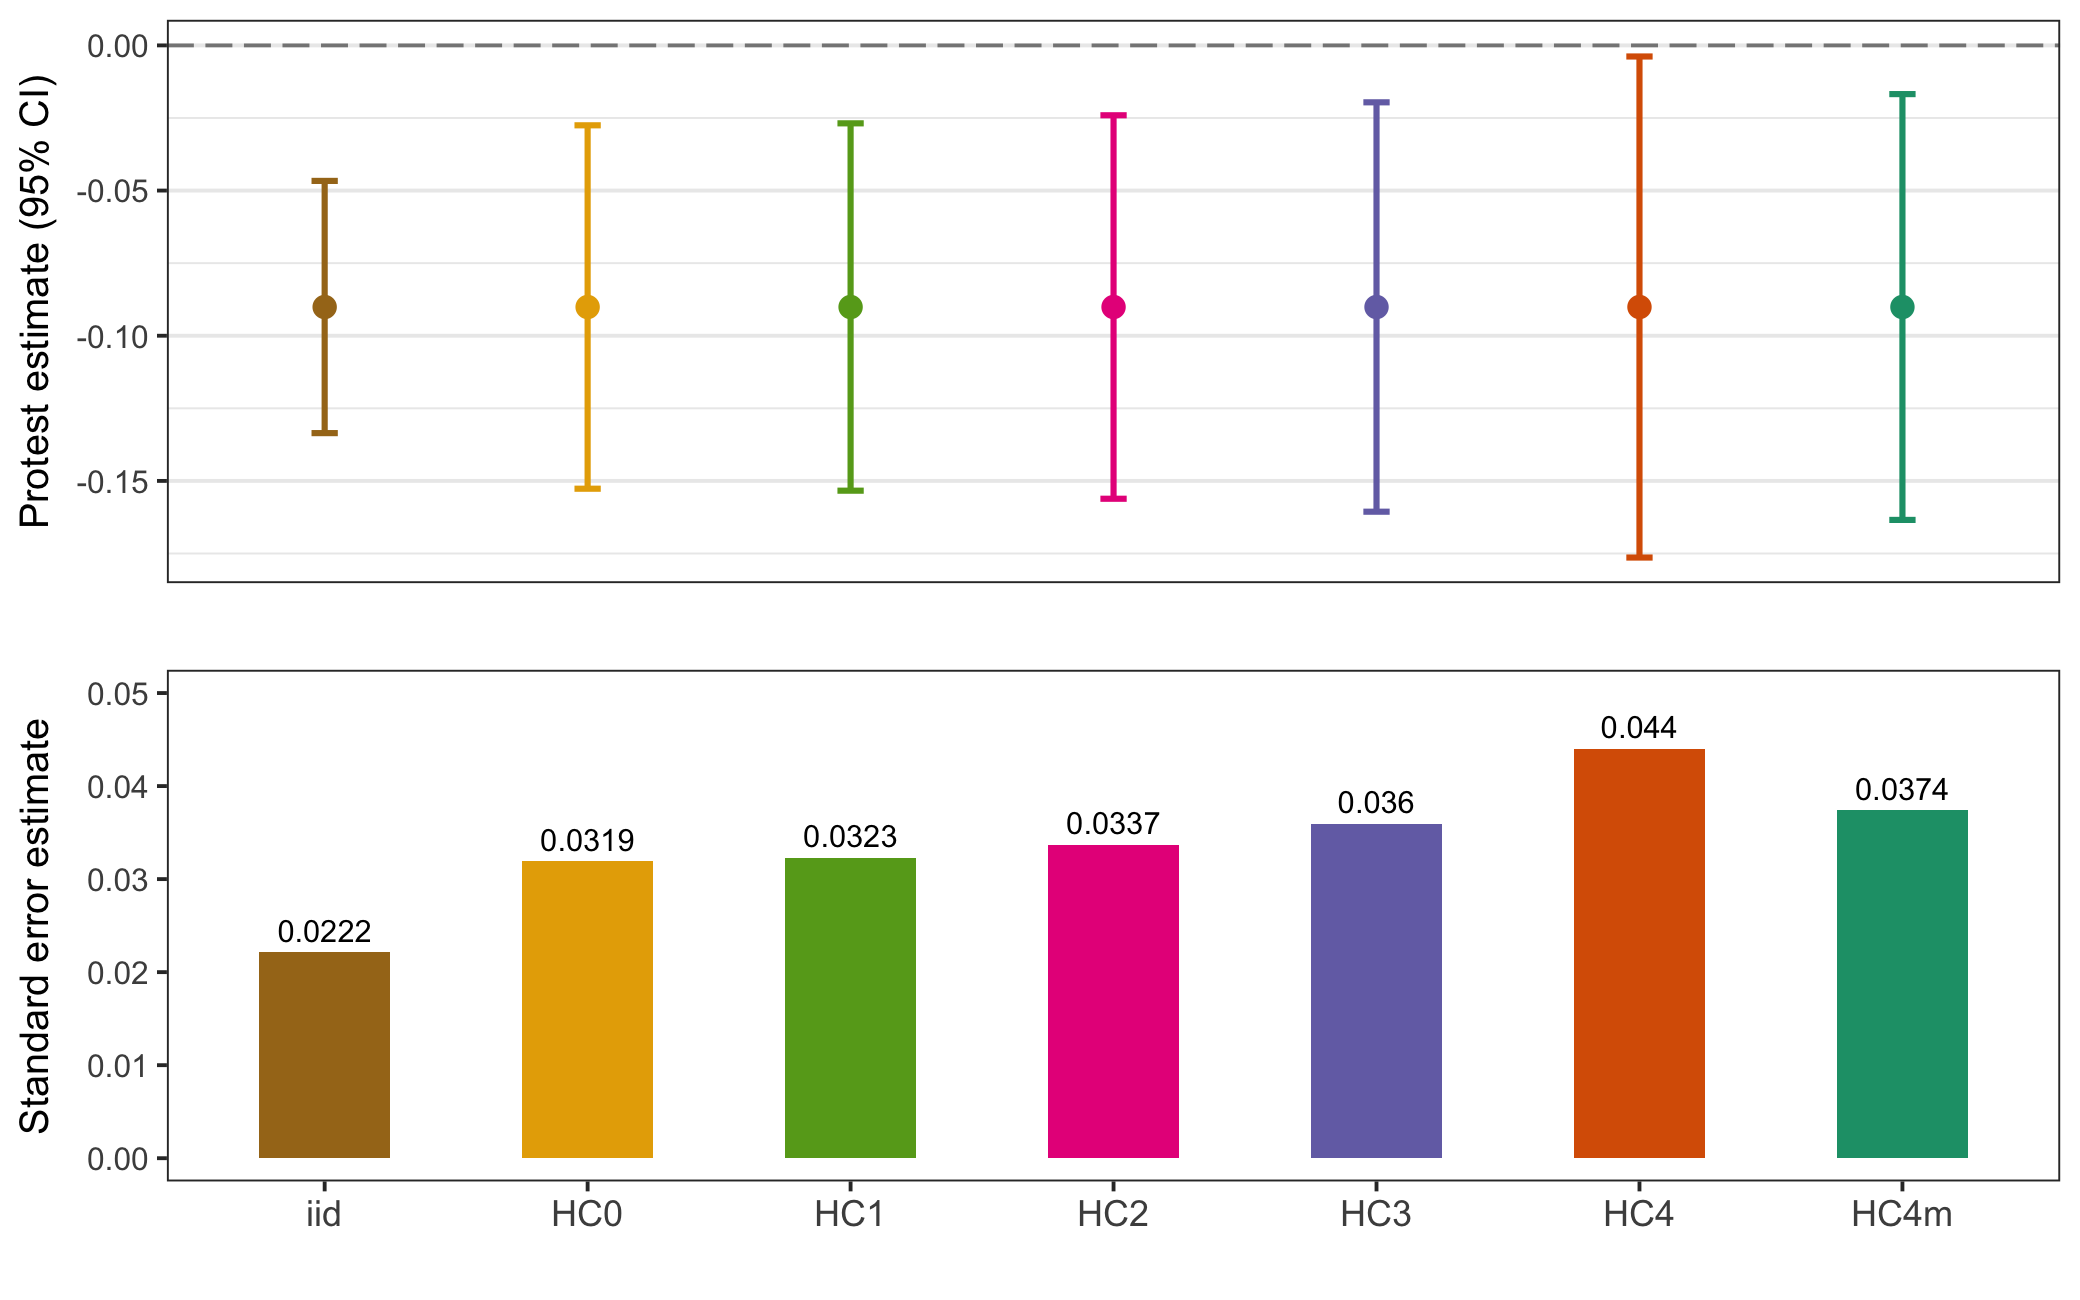
Figure 5.7: Racial Resentment Model 1 Standard Error Comparison
I start with the first model whose outcome variable is racial resentment. In Figure 5.7 I estimate 7 kinds of standard errors (HC5 errors are omitted as they are extremely inflated for larger sample sizes (Job and Oyejola 2014), bootstrapped errors also omitted since the model is parametric). The top pane is a coefficient plot, showing the point estimate of the protest indicator by 95% confidence intervals, while the bottom pane compares the actual standard error estimates. As we would expect, iid errors are smaller than HC errors. The type of HC error used (Mazumder uses HC2) makes little difference in the substantive interpretation of the estimate. HC4 errors are slightly larger than the others, however these errors are typically reserved for use when a model has observations with high leverage, which looking at Figure 5.8 does not appear to be the case.
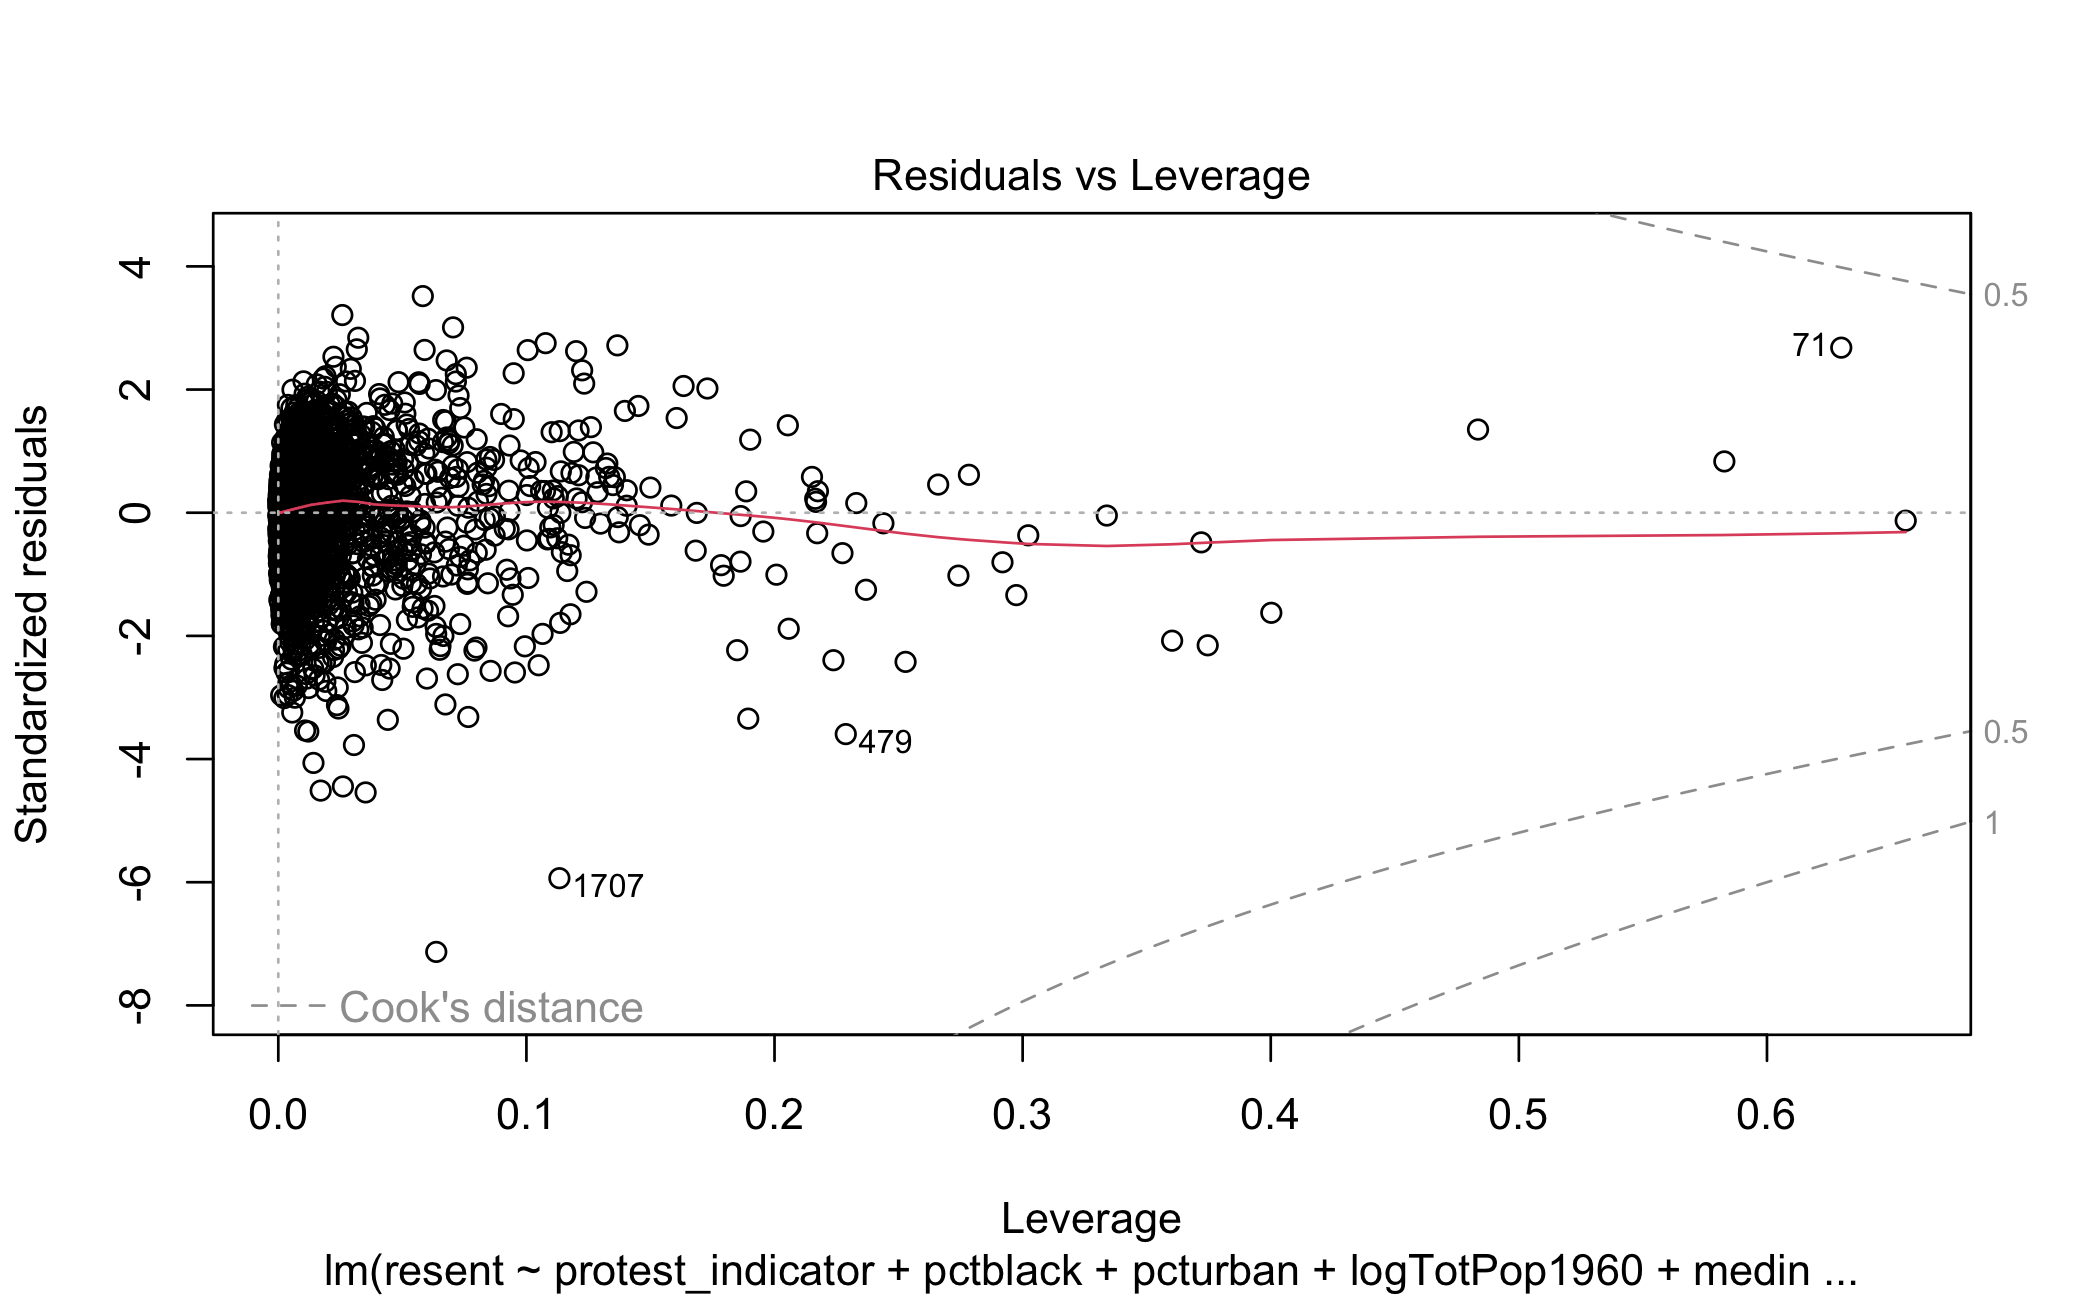
Figure 5.8: Residuals vs. Leverage for Racial Resentment Model

Figure 5.9: Affirm. Action Model 2 Standard Error Comparison
Moving on to the affirmative action model in Figure 5.9, the story is largely the same. The only notable difference here is that, with HC4 errors, the point estimate is no longer differentiable from zero. But looking again at the leverage of the model HC4 errors do not appear necessary.
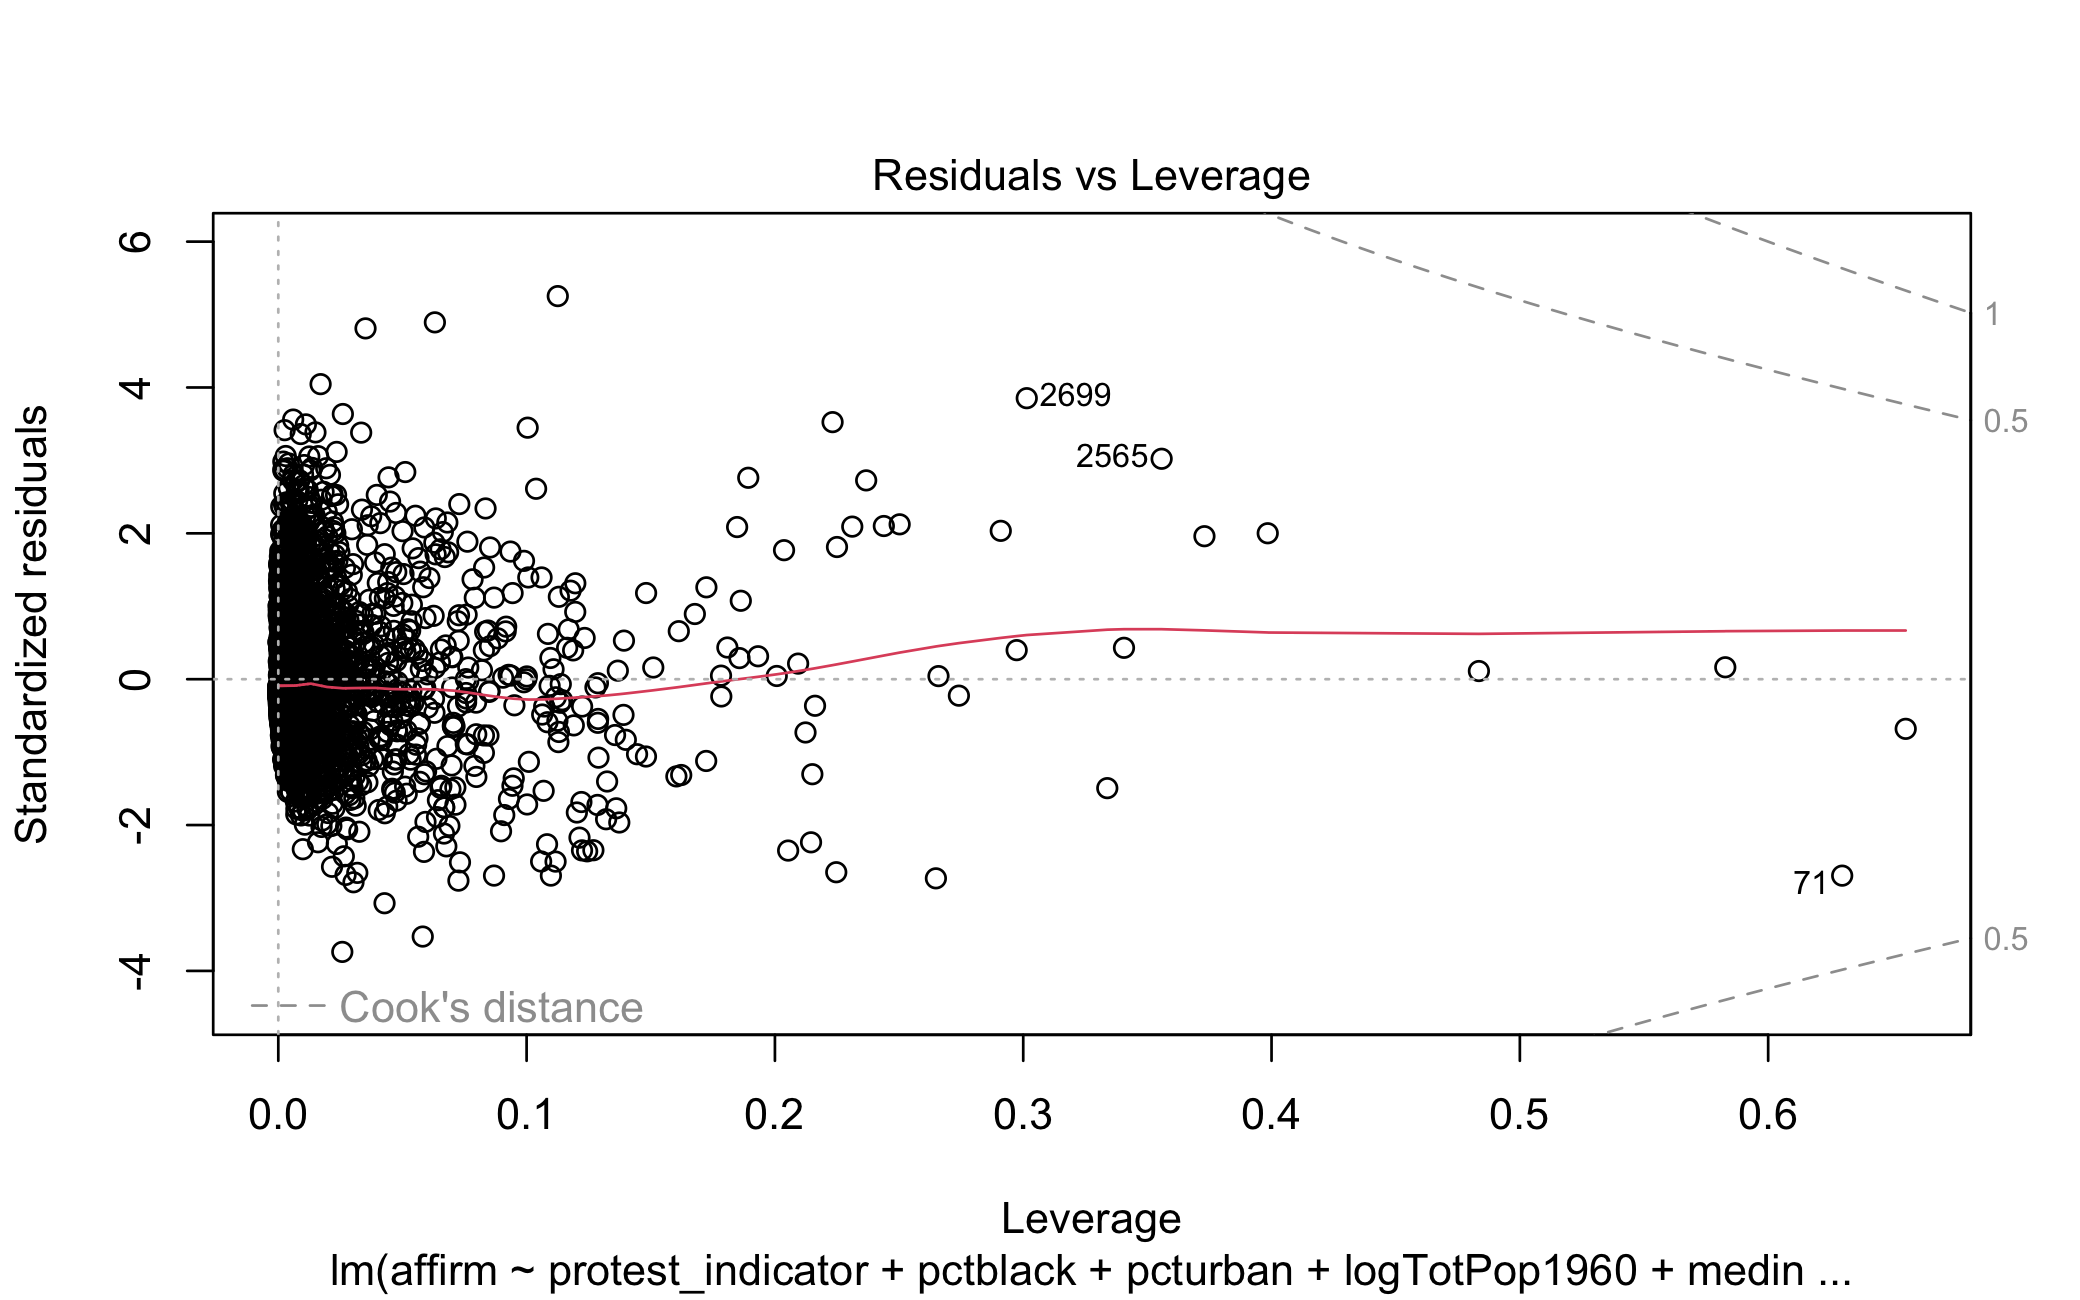
Figure 5.10: Residuals vs. Leverage for Affirm. Action Model
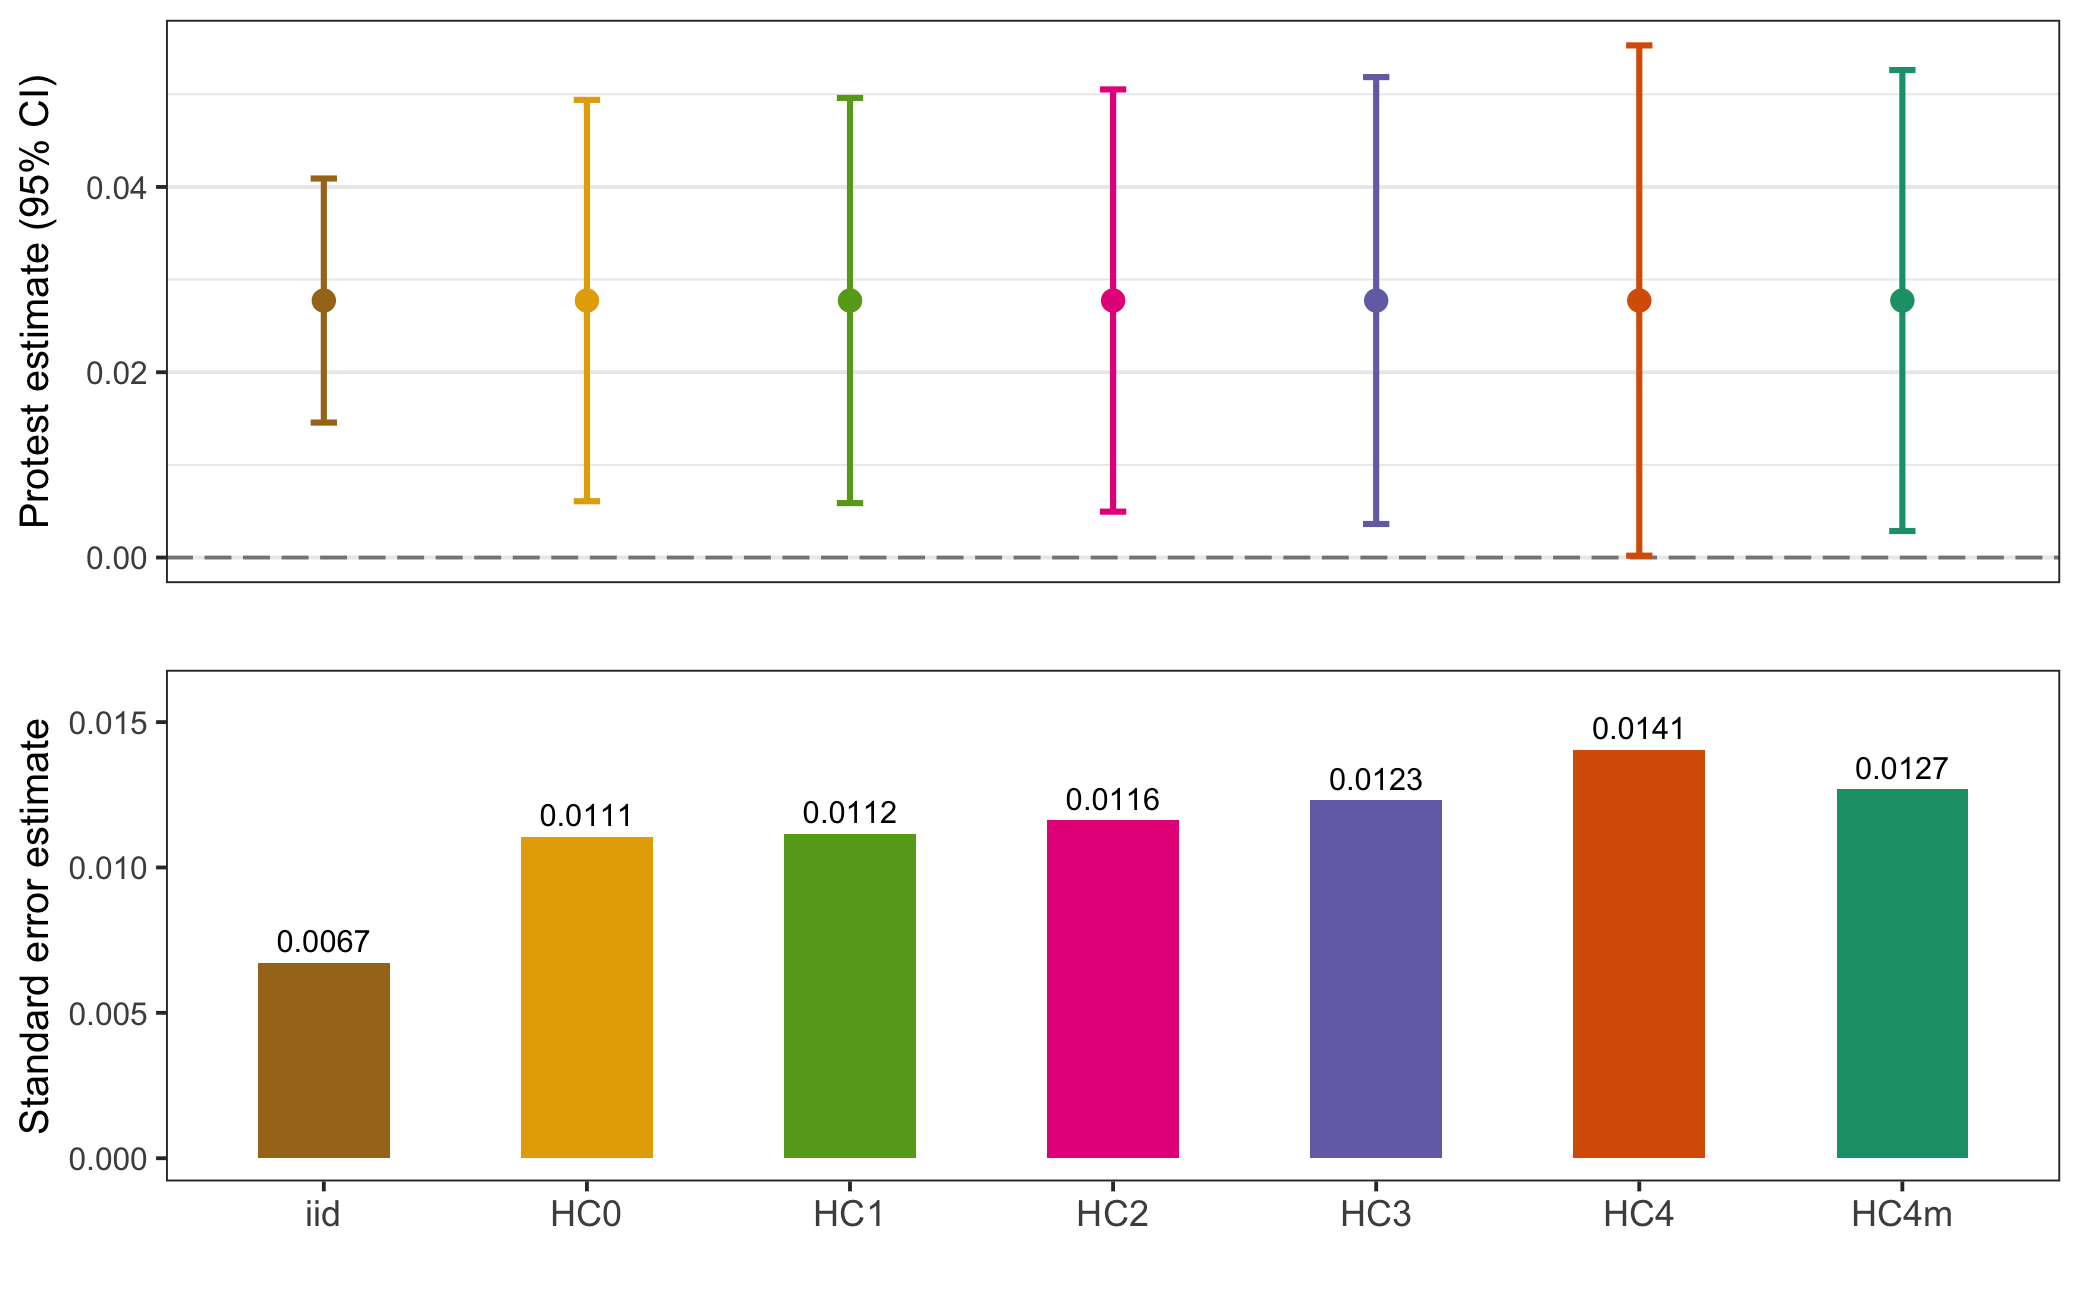
Figure 5.11: Prop. Democrat Model 3 Standard Error Comparison
Lastly, as with the others, in Figure 5.11 the estimate for the protest indicator in the proportion Democratic model is generally robust across standard error types and HC4 is unnecessary given Figure 5.12 below.
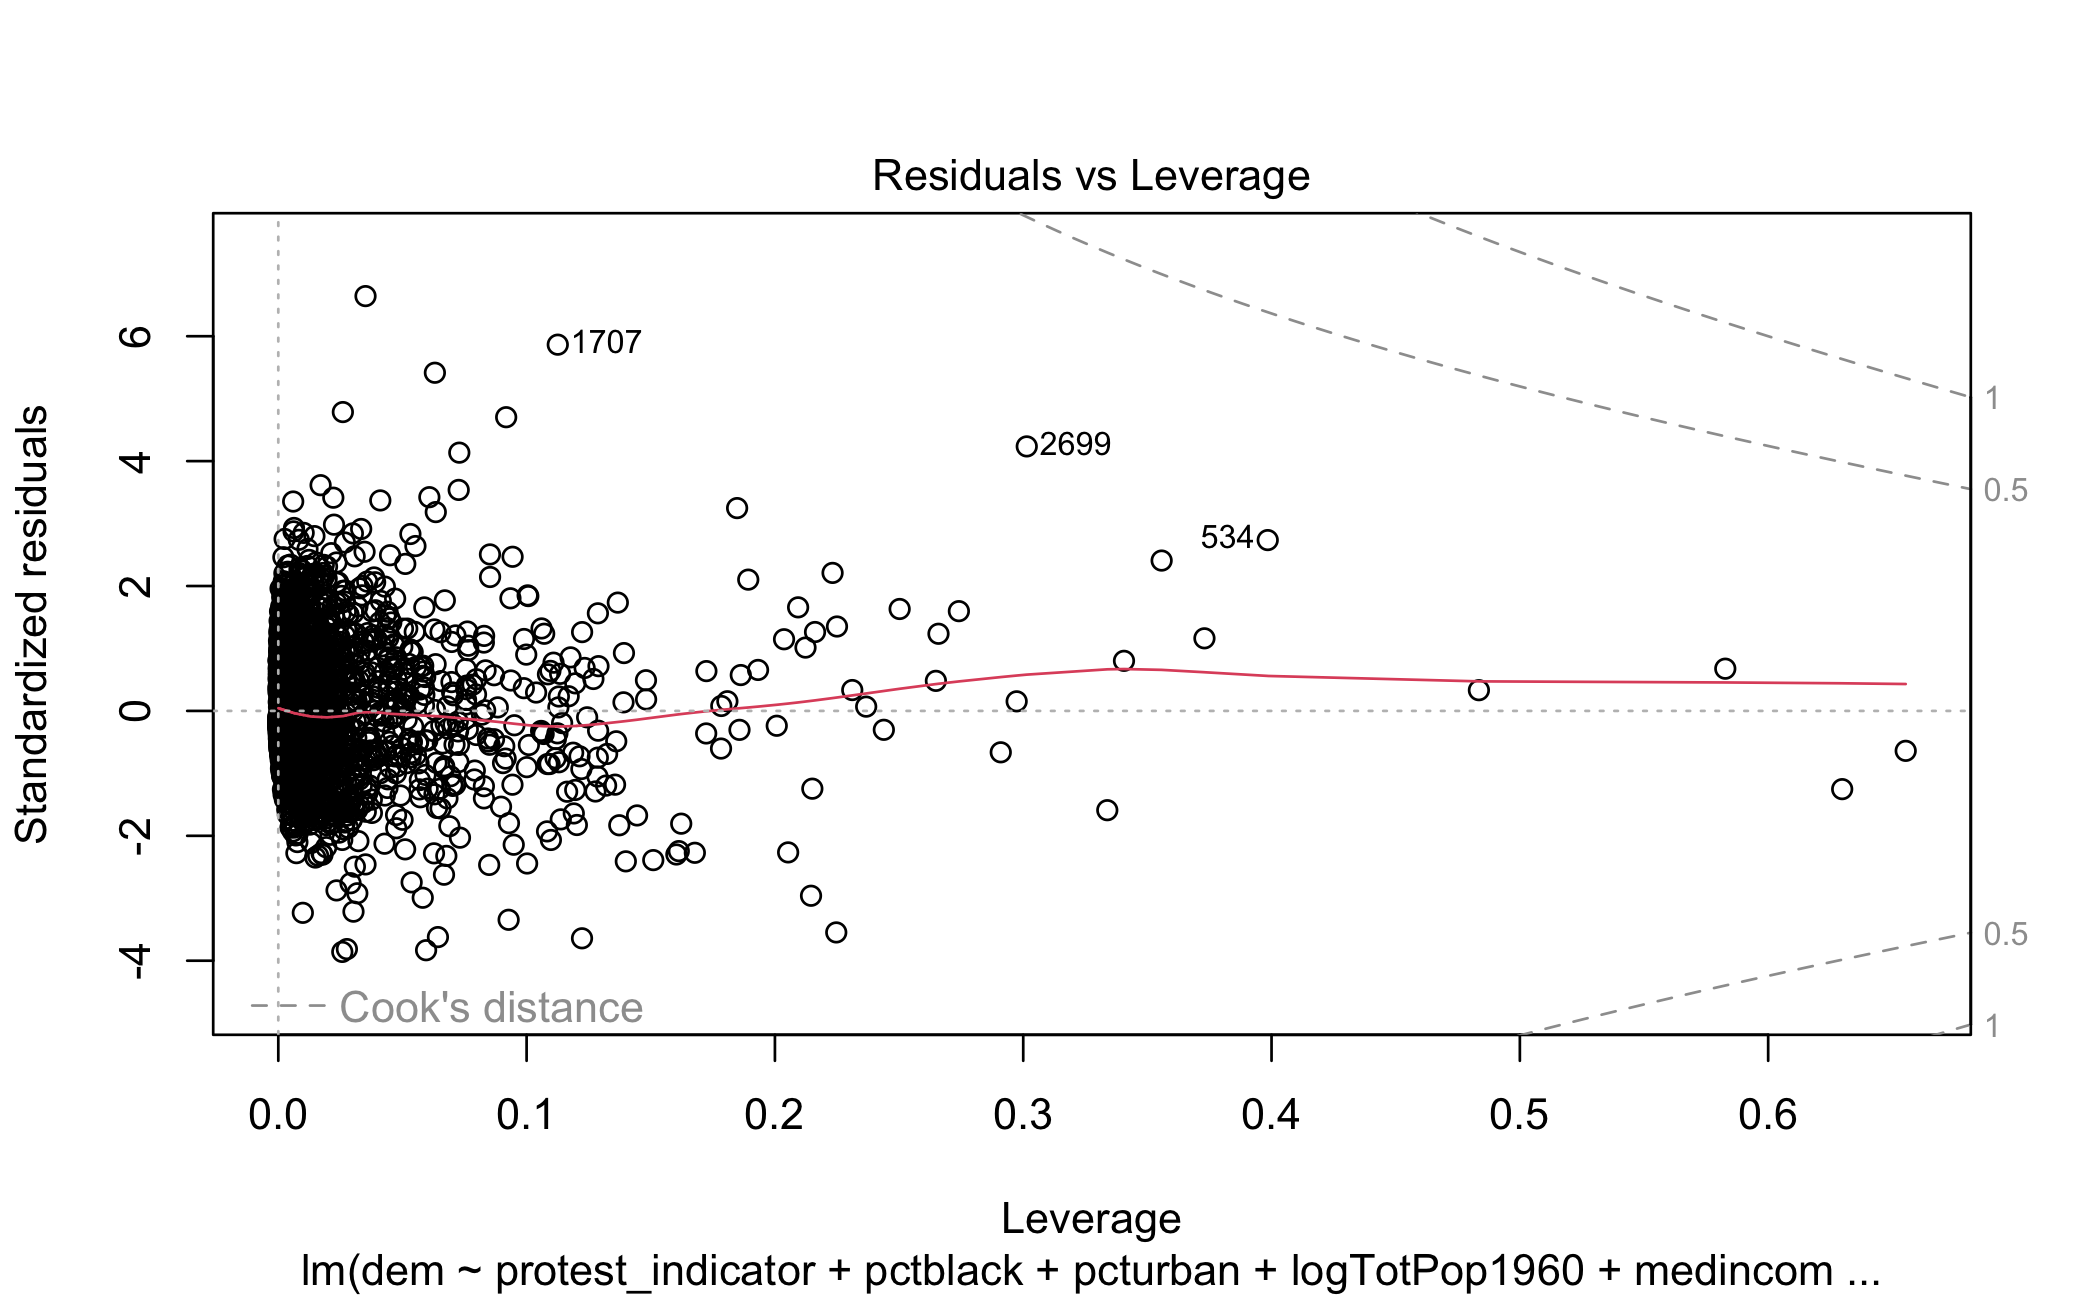
Figure 5.12: Residuals vs. Leverage for Prop. Democrat Model
In sum: a specification curve analysis of Mazumder’s results in Table 1 finds them to be insensitive to model specification.
6 Concluding Thoughts
The intent of this write up is to give a sense as to why one would want to develop a software package and how they would go about doing it. In my experience it has certainly been a time intensive process but one that I’m glad I went through with (anything besides actually writing my dissertation, of course). And I’m by no means finished–every time I use my package I think of something I want to improve or add onto it. Just in the course of writing this I’ve realized I want to add:
- Plotting functions for comparing standard errors (the plots in this post were simply made using the output of
se_compare()) - Support for model types beyond generalized linear models
- A more direct means of seeing how model output changes with different fixed effects
- Support for random effects
- A way to compare the p-value produced under different standard error specifications
Needless to say, there’s a lot to do and I look forward to continue learning more about methods and development along the way.
References
It’s worth noting there are many who are up to the task, I wouldn’t have ever contemplated developing an
Rpackage if I didn’t have the likes of Professors Molly Roberts and Jasper Cooper, developers of thestmandDeclareDesignpackages, respectively, in my department.↩︎It should be noted that while developing
speccurvieR,specrimplemented ggplot and other features that now make it a very robust package. An excuse to keep working on and improving my own package!↩︎It does seem in more recent versions of
Rthat*apply()functions have similar computational complexity to for loops due to improvements to loop compilation. Using*apply()functions is still preferable due to their concise syntax and compatibility with a functional-language paradigm. In this case they also make implementing parallelization much easier.↩︎In my experience it’s very common for graduate student peers or undergraduates to shy away from
*apply()because they were only every taught about for loops–this is a real shame since once you understand how to use them they are maybe the most powerful functions inR.↩︎