Projects/Side Quests
Dashboards, R packages, and replications of papers I find interesting.
R & Statistics — Master Notes
Ground-up notes on R and applied statistics I wrote in grad school and have since passed around to people learning the basics — from data types and functions through plotting, regression, model diagnostics, robust/clustered standard errors, and bootstrapping. The web version has live, editable R code cells that run in your browser (via WebR, no install), with a PDF for offline reading.
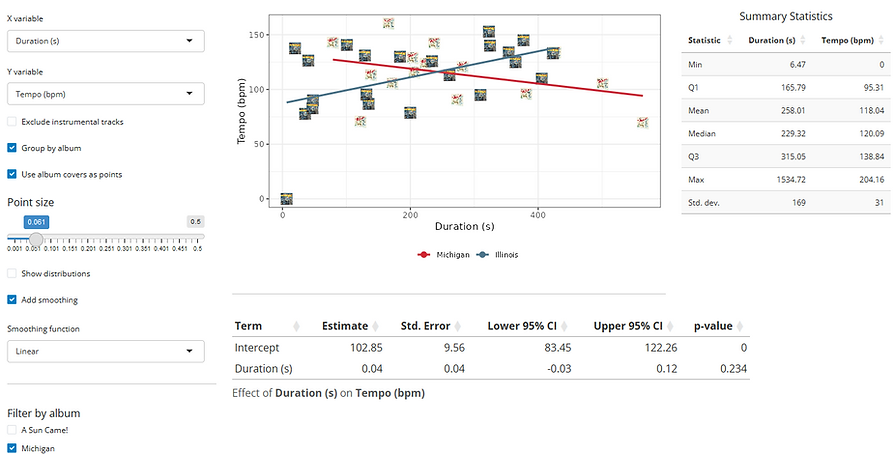
SufjanViz
An interactive dashboard for visualizing and analyzing the discography of Sufjan Stevens, built with Shiny for R.
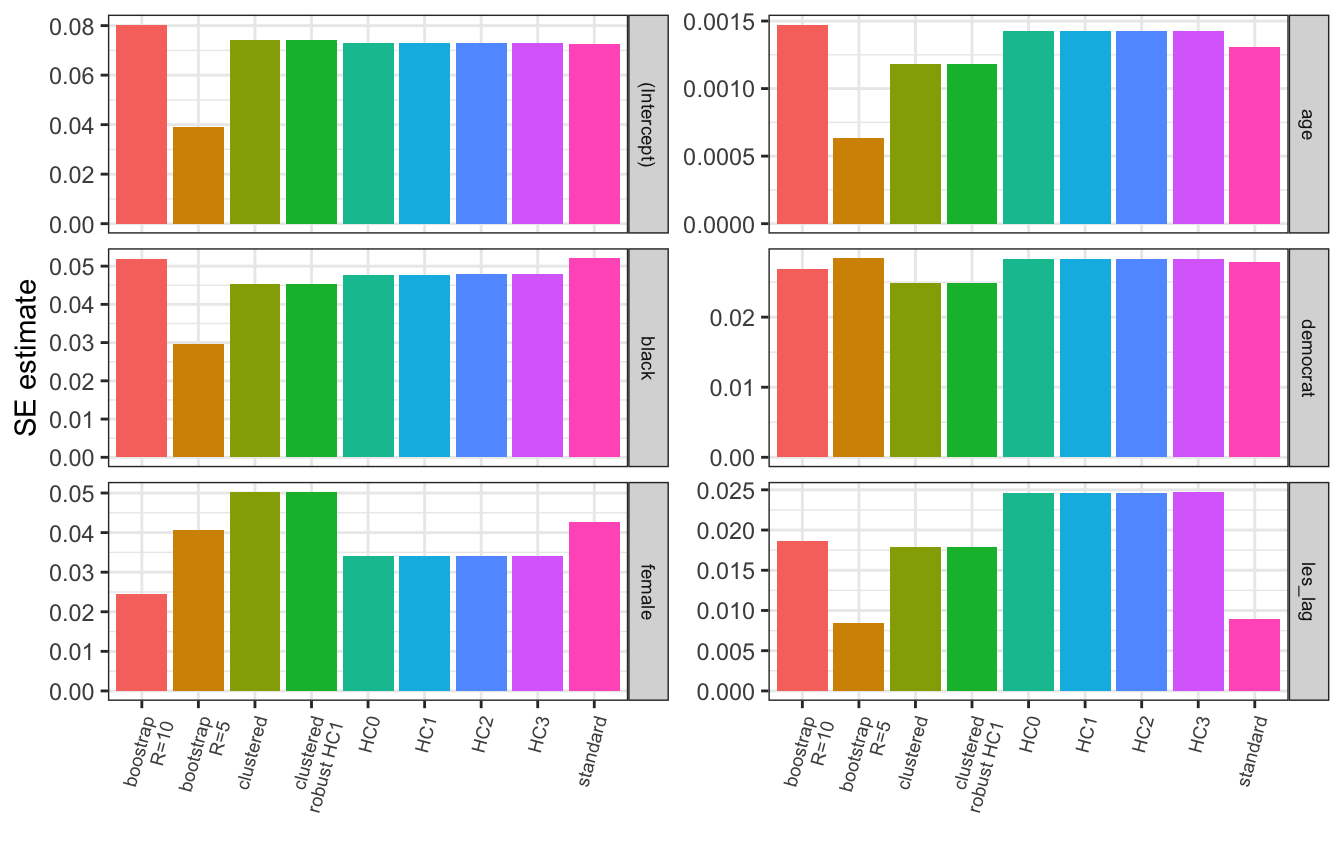
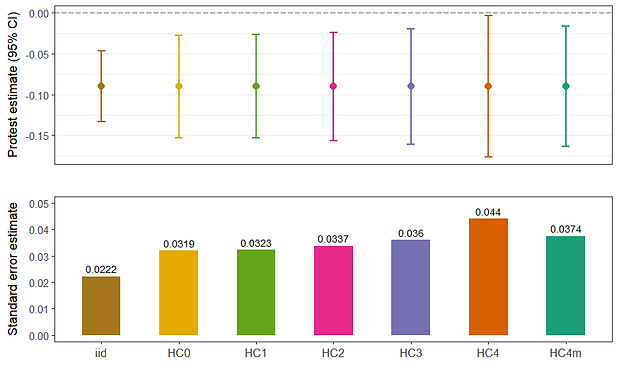
speccurvieR
Specification curve analysis made easy, fast, and pretty. Improves on existing offerings with GLM support, parallelization, fixed effects, standard error comparison, and tidyverse integration. Available on CRAN.
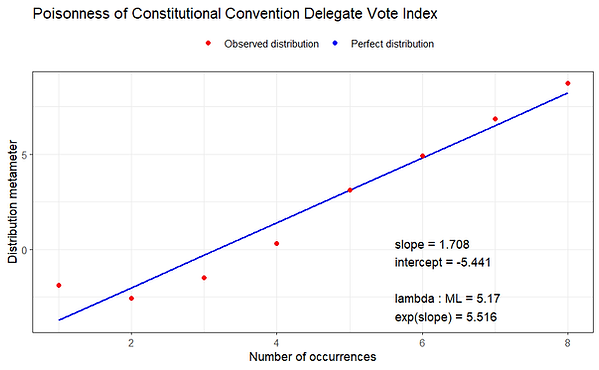
plotness
Poissonness, binomialness, and negative binomialness plots with ggplot, improving on the vcd library’s distplot — or get the underlying data to plot with your preferred graphics library.
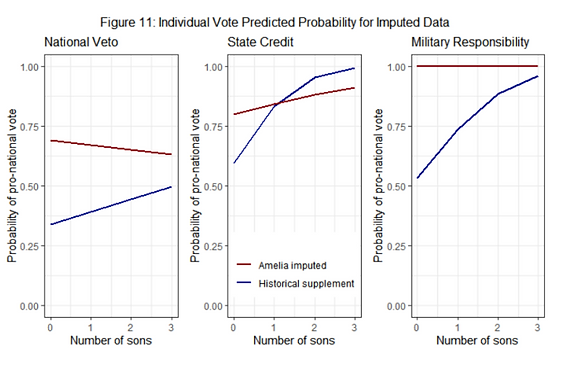
Father Founders: Did Child Gender Affect Voting at the Constitutional Convention?
Pope & Schmidt (2021, AJPS) estimate the effect of delegates’ family composition on their voting behavior at the Constitutional Convention. Originally done in Stata, I replicate the analyses in R with additional diagnostics and counterfactuals considered.
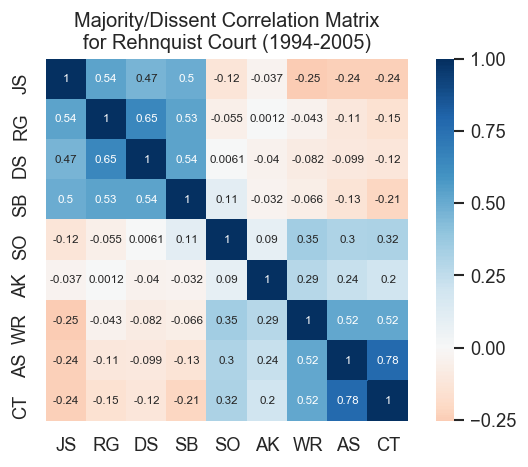
Statistical Mechanics of the US Supreme Court
Lee, Broedersz & Bialek (2015) model the Rehnquist-era Supreme Court as a system of magnetic dipoles to understand when unanimity emerges. I partially replicate the analyses using Python.