SufjanViz is a Shiny for R dashboard for exploring the discography of Sufjan Stevens — and for digging into how my own listening behavior relates to underlying characteristics of his music, from loudness and tempo to lyrical sentiment.
A few things you can explore
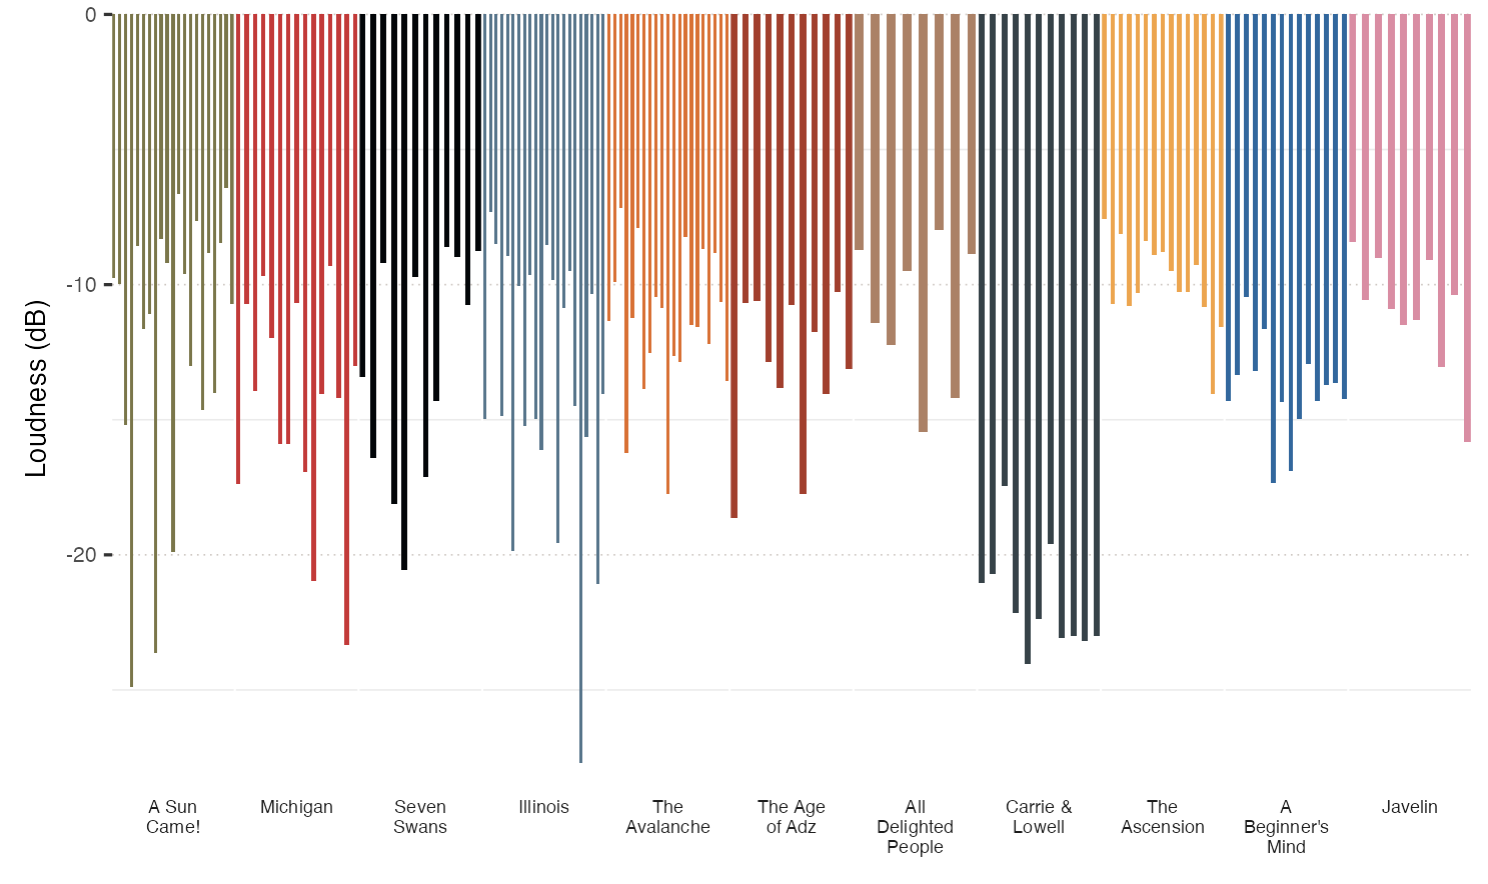
Every album’s tracks laid out by loudness — Sufjan’s quietest records (the hushed Carrie & Lowell, Seven Swans) stand apart from his maximalist ones at a glance:
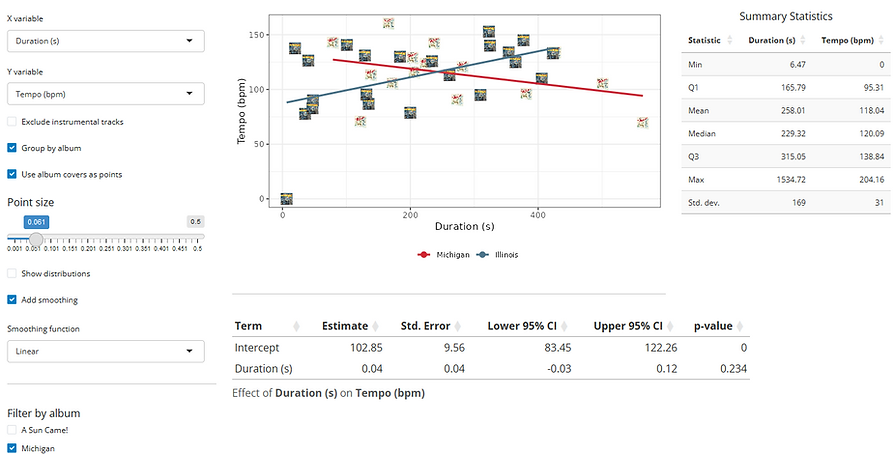
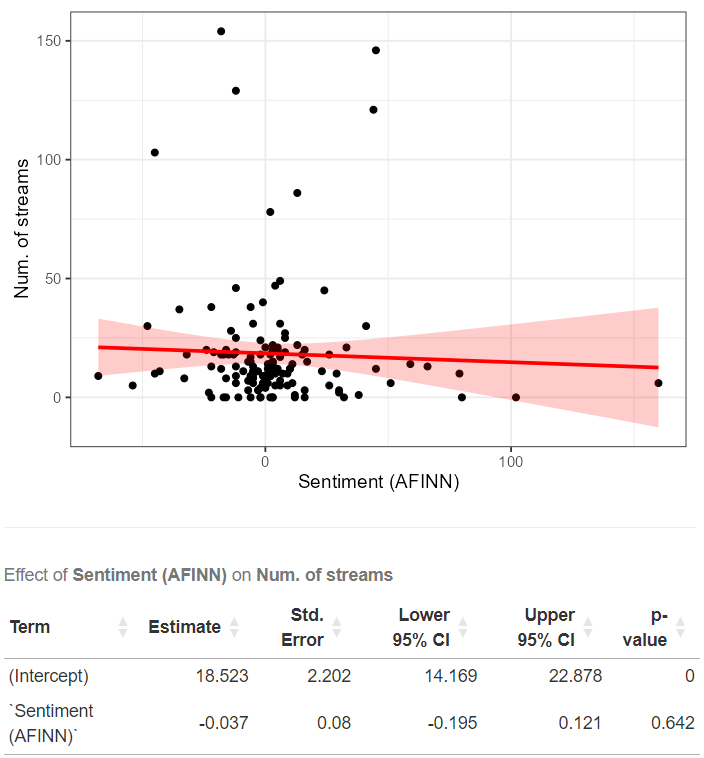
Or test whether the data backs up a hunch — for instance, does the lyrical sentiment of a track have anything to do with how much I actually stream it? (Short answer: not really.)
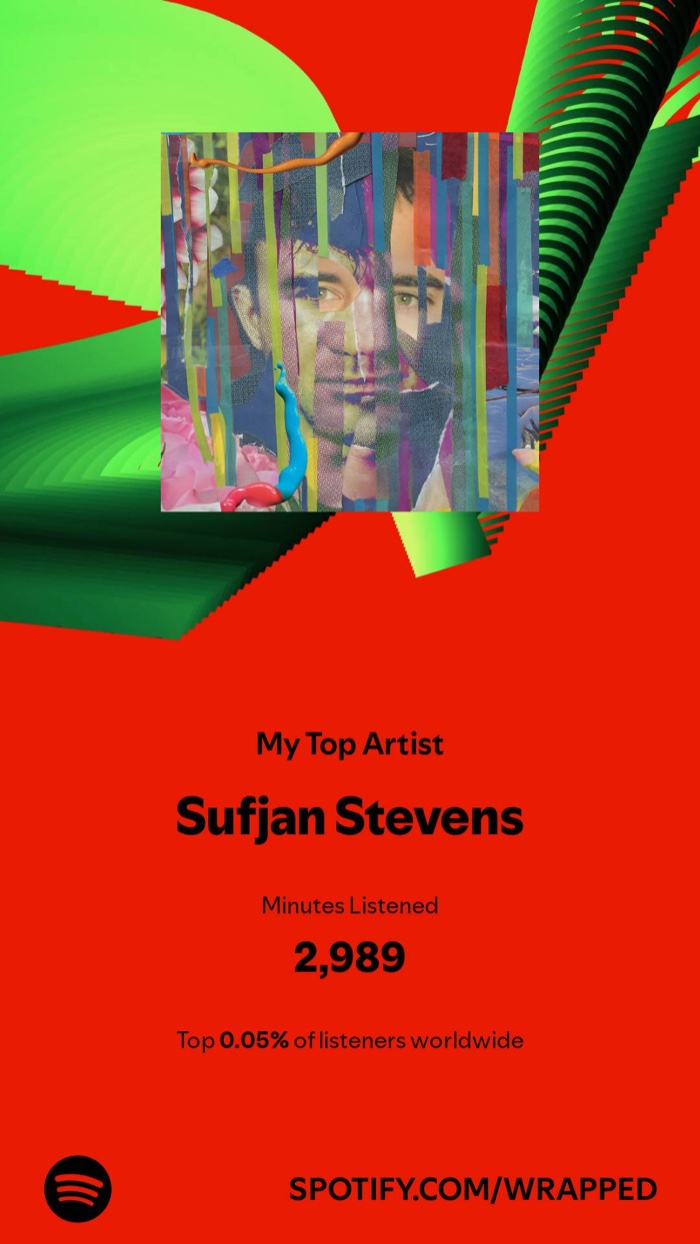
And because the dashboard joins in my Spotify takeout data, it can put my own listening — Wrapped-style — side by side with the audio features above:
Data & tools
- Lyric data and album art from Genius
- Track audio features scraped from Spotify via the spotifyr wrapper
- My personal streaming history from a Spotify data takeout
- Word clouds via Wordcloud2, all other plots in ggplot2
Try it inline
The dashboard is hosted on shinyapps.io and sleeps when idle, so it isn’t embedded by default — click to load it here (it may take ~20 seconds to wake up), or open it in a new tab ↗.